Development of a quantitative, cell-based, high-content screening assay for epidermal growth factor receptor modulators1
Introduction
Epidermal growth factor (EGF), a small polypeptide (6 045 Da), was first isolated from the submandibular glands of mice[1]. It was found to have stimulating effect on epidermal cell proliferation, differentiation[2], and migration[3,4]. EGF exerts its effects via EGF receptor (EGFR), which belongs to the superfamily of receptor tyrosine kinases[5,6]. After binding to ligands, this receptor dimerizes, leading to autophosphorylation, initiation of intracellular signaling cascade, and eventually receptor internalization[7–9].
The main pathway linked to EGFR activation involves Ras, a small GTP-binding protein, followed by the activation of the mitogen-activated protein kinase pathway, which eventually leads to the phosphorylation of extracellular signal response kinases (ERK) 1 and 2. Phosphorylated ERK enters the nucleus and activates the transcription of various genes, including those required for cell proliferation, differentiation, and migration[8]. The binding of EGF to its receptor also causes the receptor’s downregulation at the cell surface due to receptor-mediated internalization. The internalized ligand–receptor complex is eventually sent to endosomes and lysosomes and degraded by enzymes present in these compartments[10,11]. Therefore, internalization of EGFR might be used as an indicator of its activation by agonists and the activation of downstream signaling pathways.
EGFR is the receptor most often found to be upregulated in a wide variety of human tumors[12]. The inhibition of EGFR may present a promising method for attacking tumor invasiveness as an adjunct therapy for antimitotic therapy. EGFR has been the target of various anticancer drug development strategies, including therapeutic antibodies, kinase inhibitors, ligand-toxin conjugates, and antisense nucleotides[13]. On the other hand, EGFR activation has tremendous effect in promoting wound repair and limiting scar formation[14,15]. Thus, modulators of EGFR signaling pathway might provide important therapeutic opportunities in several areas, including cancer, organ repair, and cell production.
To identify novel EGFR modulators, an accurate and robust high-throughput assay is highly desirable to screen a large collection of chemical entities. Traditional high-throughput screening (HTS) methods usually involve expression and purification of the receptor protein and performance of kinase assay in vitro. The conditions of such assays are very different from the natural cellular environment and radioactive materials are normally used. In this paper, we describe a new, quantitative, cell-based assay for the screening of EGFR modulators based on receptor internalization and high-content screening (HCS) technology. HCS is a high-throughput, multi-parameter image analysis technology recently developed based on fluorescent microscopy. Fluorescent-tagged EGF was used to visualize the internalized ligand–receptor complex. The fluorescent intracellular spots were detected and measured with an ArrayScan HCS reader. Compounds that competitively bind to EGFR or interfere with EGFR internalization process will result in a reduced number and intensity of the intracellular fluorescent spots. This assay was validated, optimized, and applied to a large-scale screening of a library containing 48 000 synthetic compounds. Thirteen novel compounds with a relatively high degree of interference with EGFR internalization were identified. One of the compounds was proven to be an agonist of EGFR since it induced phosphorylation of the receptor and the downstream ERK protein.
Materials and methods
Reagents EGF and Hoechst 33342 were purchased from Sigma (St Louis, MO, USA). Cell culture medium, EGF biotinylated and complexed to Alexa Fluor 555 streptavidin (Alexa Fluor 555 EGF) and wheat germ agglutinin (WGA)–oregon green were bought from Invitrogen (Carlsbad, CA, USA). Formaldehyde, DMSO, Tris base, SDS, glycerol, dithiothreitol, and bromophenyl blue were purchased from Sinopharm Group Chemical Reagent Co (Shanghai, China). The phototope horseradish peroxidase (HRP) Western blot detection system, antibodies to ERK1/2, phospho-ERK1/2, EGFR, phospho-EGFR and goat anti-rabbit IgG antibody conjugated to HRP were purchased from Cell Signal Technology (Beverly, MA, USA).
Cell culture HeLa cells obtained from the American Type Culture Collection (Manassas, VA, USA) were maintained in low-glucose Dulbecco’s modified Eagle’s medium (LG–DMEM) supplemented with 10% fetal bovine serum, 100 mg/L penicillin, and 100 mg/L streptomycin at 37 °C in a humidified atmosphere of 5% CO2. Cells were trypsinized and seeded onto 96-well plates at proper density for 18–24 h before the experiments.
Alexa Fluor 555 EGF induced EGFR internalization Cells were planted onto 96-well plates overnight at desired density. Cells were then starved in serum-free LG–DMEM for 3 h. Alexa Fluor 555 EGF was added at a final concentration ranging from 0.2 to 1 mg/L and incubated at 37 °C for the indicated times. (To show clear membrane binding of Alexa Fluor 555 EGF, the first 2 min of incubation were on ice.) To study the competition between EGF and Alexa Fluor 555 EGF or compound interference with EGFR internalization, cells were pretreated with unlabeled EGF or compounds for 10 min before the addition of Alexa Fluor 555 EGF. Cells were then washed 3 times with prewarmed phosphate-buffered saline (PBS) and fixed with 3.7% formaldehyde for 15 min. The cell membrane was stained with 5 mg/L WGA–oregon green for 30 min and the cell nuclei were stained with 10 mg/L Hoechst 33342 for 15 min, respectively. The plates were either observed with an Olympus IX51 inverted fluorescent microscope or analyzed with an ArrayScan 4.0 HCS Reader (Cellomics, Pittsburgh, PA, USA).
Imaging and data generation Images and data of the cells were obtained with an ArrayScan HCS 4.0 Reader. Appropriate filter sets were used for the detection of Hoechst-labeled nuclei and the Alexa Fluor 555 EGF/EGFR complex. A 10 or 20× microscope objective was used for the imaging, and the spot detector bioapplication was used to acquire and analyze the images after optimization of the application protocol. Around 500 cells from randomly-picked fields were analyzed for each well.
HCS campaign The compound library used for the screening was comprised of 48 000 different compounds. A 10 compound pool/well mix was applied to the primary screening, with an average final concentration of 3 µmol/L for each compound. This matrix system maximized the advantage of HTS and allowed duplicate screening of each compound[16]. In each 96-well plate, 8 wells were used as positive controls (10 nmol/L EGF in 1% DMSO) and another set of 8 wells as negative controls (1% DMSO). The inhibition rate of 10 nmol/L EGF was normalized to 100% and that of the negative control was 0. The inhibition rate of each compound was calculated with the following equation:
Inhibition %=(Spot countcompound–Spot count1%DMSO)/(Spot countEGF–Spot count1%DMSO)×100%. The samples showing more than 80% inhibition were considered “hits” in the primary screening.
Western blotting HeLa cells were seeded onto 6-well plates and cultured overnight. Then the cells were serum starved for 16 h. Compounds were added directly into the culture medium at desired concentration and incubated for various time periods. After removal of the culture medium, the cells were lysed with sample buffer (62.5 mmol/L Tris-HCl, 2% SDS, 10% glycerol, 50 mmol/L dithiothreitol, and 0.01% bromophenyl blue [pH 6.8]). After immediate scraping, the lysates were sonicated for 10–15 s and then boiled at 95–100 °C for 5 min. The protein concentration was determined with the Bradford method and 10 μg of total protein was loaded onto 12% SDS–PAGE gels and electrophoresed at 60 V with Tris-glycine running buffer (25 mmol/L Tris-HCl, 250 mmol/L glycine, and 0.1% SDS [pH 8.3]). The proteins were then transferred onto a PVDF membrane (Millipore, MA, USA) at 100 V for 60 min (for ERK) or 120 min (for EGFR). The membrane was incubated with blocking buffer (20 mmol/L Tris, 137 mmol/L NaCl, 0.1% Tween-20, and 5% non-fat dry milk) for 2 h at room temperature. After washing, the membranes were probed simultaneously with rabbit anti-ERK (1:1000) and rabbit anti-p-ERK (1:1000) antibodies or rabbit anti-EGFR (1:1000) and rabbit anti-p-EGFR (1:1000), respectively, for 8 h and then with goat anti-rabbit IgG HRP (1:2000) antibody for 3 h. After the final wash, the membrane was developed on Kodak X-Omat BT film (Eastman Kodak, Rochester, NY, USA) using the phototope HRP Western blot detection system (Cell Signal Technology, MA, USA) according to manufacturer’s instructions.
Data analysis Data were analyzed with GraphPad Prism software (GraphPad, San Diego, CA, USA). Non-linear regression analyses were performed to generate dose-response curves, and linear regression was used to analyze data reproducibility. Mean±SEM was calculated automatically with this software.
Results
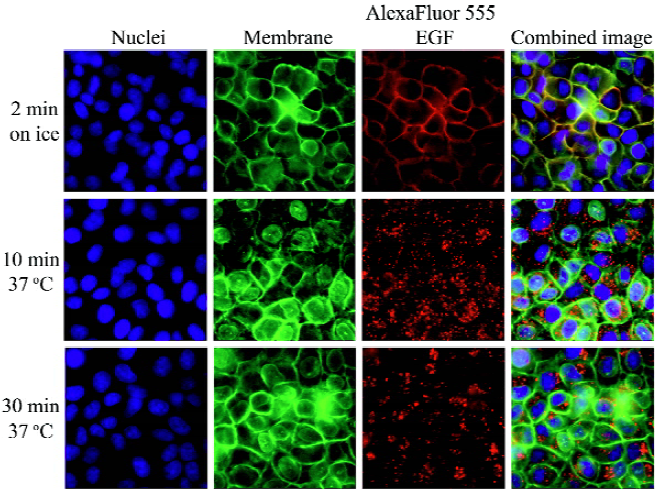
Observation of EGFR internalization with Alexa Fluor 555 EGF HeLa cell is a human cervical cancer cell line with a natural high expression of EGFR. To observe the EGFR internalization process, a fluorescent-tagged EGF (Alexa Fluor 555 EGF) was used. HeLa cells were incubated with Alexa Fluor 555 EGF for various time periods and conditions. An initial 2 min incubation on ice revealed binding of Alexa Fluor 555 EGF with the EGFR on the plasma membrane, as indicated by the colocalization of membrane marker WGA–oregon green (Figure 1). Incubation at 37 °C for 10 min led to the cointernalization of the receptor–ligand complex and formation of bright red intracellular spots. Thirty minutes later, the intracellular spots became larger and aggregated, which might be automatically identified and analyzed with a software algorithm. To visualize the competition between EGF and Alexa Fluor 555 EGF, different concentrations of unlabeled EGF were added to the cells before the addition of the Alexa Fluor 555 EGF. Higher concentrations of unlabeled EGF showed advantages in competitive binding to the EGFR and resulted in a reduced number and intensity of intracellular spots (Figure 2). Compounds that competitively bind to the EGFR or interfere with the internalization process should also cause reduced intracellular spots.
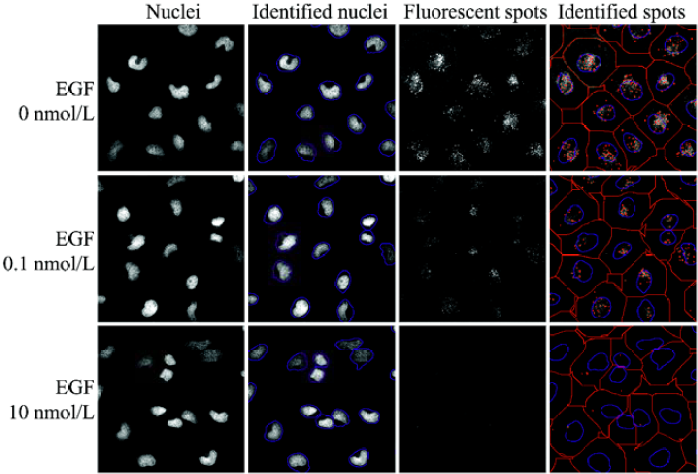
Imaging and analysis by the HCS reader An ArrayScan 4.0 HCS reader, equipped with a software module, the spot detector bioapplication, was used for imaging and data analysis. Two imaging channels with proper filters were used to photograph nuclei (Figure 2, lane 1) and intracellular spots (Figure 2, lane 3). After optimization of the bioapplication’s protocol settings, the software was able to automatically detect nuclei (Figure 2, lane 2) and intracellular spots (Figure 2, lane 4). Relevant readouts from this software included cell density, spot count/cell, spot total intensity/cell, and spot total area/cell. The results also indicated that an increase in the dose of unlabeled EGF significantly reduced the Alexa Fluor 555 EGF-labeled intracellular spot number and intensity.
Assay optimization Various experimental conditions were tested for assay optimization. The intracellular spot counts increased with the elongation of the incubation time with Alexa Fluor 555 EGF. After 30 min of incubation, the spot counts reached a plateau (Figure 3A). The use of a high-power microscope objective (20× vs 10×) resulted in increased spot counts due to better image resolution (Figure 3B). Different cell densities were also tested. As shown in Figure 3B, the maximal spot count exceeded 20 with low cell density (10 000 cells/well), but in high cell density wells (30 000 cells/well), the maximal spot count was only about 14. Higher concentration (1 mg/L) of Alexa Fluor 555-EGF significantly increased the signal (Figure 3B,3C), but due to the increased cost, we eventually decided on the low concentration (200 μg/L), which proved to be adequate for screening as discussed later.
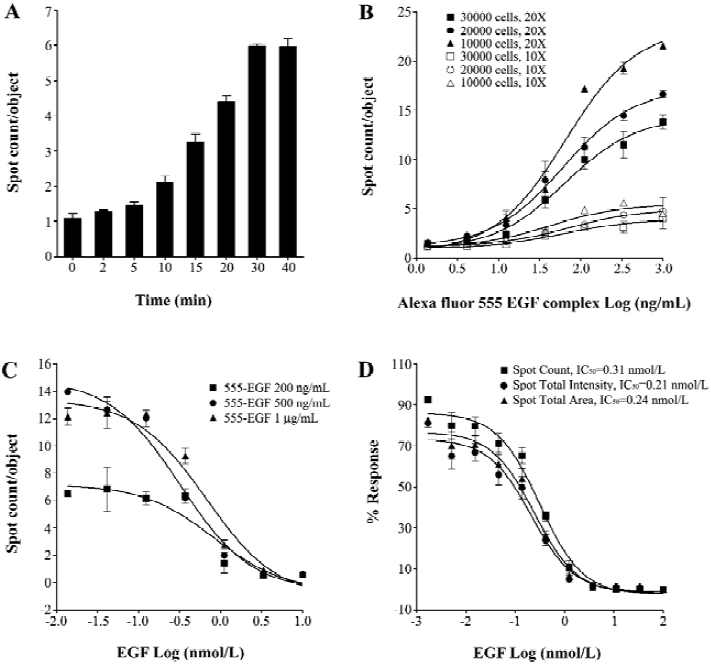
Several readouts, including spot count/cell, spot total intensity/cell and spot total area/cell compared in the EGF/Alexa Fluor 555 EGF competition assay (Figure 3D) were found to yield similar results. The IC50 values of unlabeled EGF calculated from different readouts were all approximately 0.2 nmol/L, which is in agreement with previously reported values (0.2–0.4 nmol/L)[17].
The final assay conditions for HCS were determined as follows: cell density was 10 000 cells/well, the concentration of Alexa Fluor 555 EGF was 200 μg/L; the incubation time with Alexa Fluor 555 EGF was 30 min, and the quantitative readout was spot count/object.
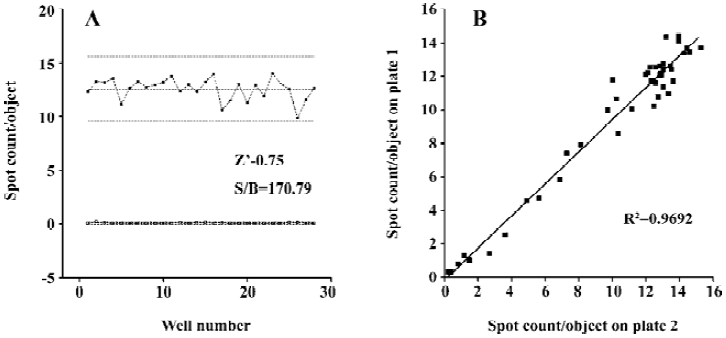
Assay performance The Z’ value is used to assess the robustness of an assay for screening and is the normalized 3 SD window between the negative and positive controls[18]. The Z’ value for the assay was 0.75 and the signal/background (S/B) ratio was 170, indicating that the system was adequately optimized for HCS (Figure 4A). Furthermore, to investigate reproducibility between duplicate plates, the corresponding wells from 2 different 96-well plates were treated with same concentration of EGF followed by Alexa Fluor 555 EGF treatment. The data from corresponding wells of different plates were analyzed with linear regression analysis[19]. The correlation coefficient was 0.97, showing a high degree of reproducibility between duplicate sample plates.
HCS campaign Of the 48 000 samples initially screened, 184 hits (0.38%) showing more than 80% inhibition on Alexa Fluor 555 EGF-induced EGFR internalization were discovered (Figure 5A). Secondary screening (single compound/well) was carried out to further confirm the hits (Figure 5B). Finally, 13 compounds displaying consistent inhibitory effects from secondary screening were picked out and analyzed in a duplicate setup. Due to compound availability, one of the hits with a novel structure (WJ-12) was further analyzed with traditional Western blot assay.

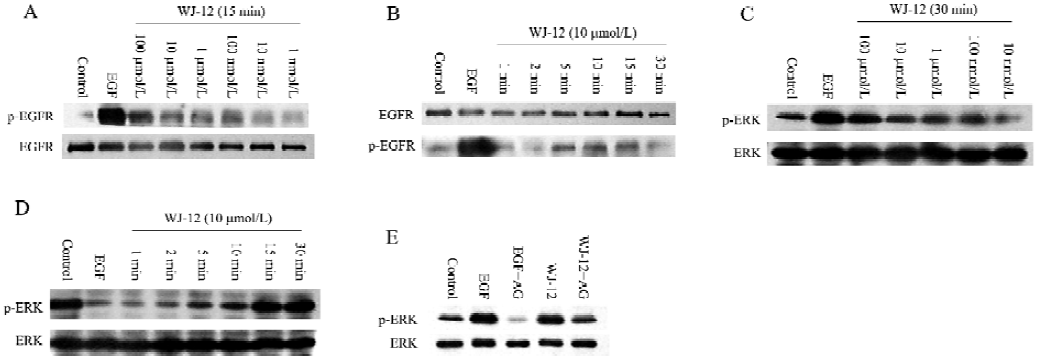
EGFR and ERK activation by compound WJ-12 We used Western blot analysis to distinguish the agonist or antagonist nature of compound WJ-12. This compound was found to induce EGFR and downstream ERK phosphorylation in a dose- and time-dependent manner (Figure 6A–6D). The activation of ERK by WJ-12 could be significantly blocked by 1 µmol/L EGFR tyrosine kinase inhibitor, tyrphostin AG1478[20] (Figure 6E), which indicated the phosphorylation of ERK by WJ-12 was via direct activation of EGFR.
Discussion
In 1997, with the debut of first ArrayScan reader, a dramatically new approach to early drug discovery was introduced as HCS technology. With 3 key research components, automatic fluorescence microscopy, fluorescence-based reagents, and image analyzing software, HCS is a technology platform designed to define the temporal and spatial activities of genes, proteins, and other cellular constituents in intact cells. Early research papers demonstrated that cellular functions, such as transcription factor activation[21], cytotoxicity[22,23], and G-protein coupled receptor internalization[24] could be quantified by HCS in a screening setup.
Ligand-induced EGFR internalization is an important event in EGFR signal transduction and has been observed with many previous studies[10,11]. With the development of fluorescent-conjugated EGF and HCS technology, the internalization of EGF/EGFR might be used as an indicator for receptor activation and to search for new compounds that interfere with this process.
In this article, we demonstrated a robust, cell-based HCS assay for the identification of EGFR modulators. In this assay, the Hoechst 33342 was used to label the cell nuclei and fluorescent-conjugated EGF was used to monitor EGF/EGFR complex internalization. Therefore, compounds competitively binding to EGFR or interfering with the internalization process would result in a reduced amount and intensity of intracellular fluorescent spots.
In the optimization procedure of assay development, many factors, such as cell density, incubation time, the concentration of Alexa Fluor 555 EGF, image magnification, and other parameters, have to be considered in order to maximize the S/B ratio and assay throughput. For example, the amount and intensity of the fluorescent spots would increase with incubation time, but prolonged treatment would reduce the assay speed and lead to fluorescent degradation, which would eventually cause signal reduction. While testing the concentration of Alexa Fluor 555 EGF, we found that an increase in the concentration would increase the signal, but considering the cost of large scale screenings, we chose the low concentration of 200 μg/L without affecting the assay performance. The Z’ factor and S/B ratio were used to evaluate the assay. The Z’ factor was widely used for the evaluation of HTS/HCS assay qualities[18]. Generally speaking, if the Z’ factor is above 0.5, the system could be considered suitable for the HTS/HCS. The assay described here had a Z’ factor of 0.75 and an S/B ratio of 170, which indicated that the assay was of high quality for HCS.
This assay was applied to a large-scale screening of a compound library consisting of 48 000 synthetic compounds. Thirteen compounds displaying consistent inhibitory effects were found. One of the compounds with a novel structure (WJ-12) was further analyzed with Western blotting to identify its agonist or antagonist nature. The results revealed that WJ-12 induced EGFR and downstream ERK phosphorylation in a dose- and time-dependent way. The activation of ERK was significantly blocked by EGFR tyrosine kinase inhibitor, tyrphostin AG1478, which indicated the phosphorylation of ERK by WJ-12 via direct activation of EGFR.
In summary, a quantitative, cell-based, high-content screening assay was developed and validated for the identification of compounds with specificity and functionality for EGFR. Compared with the conventional radioactive kinase assays, this assay was performed in a more physiological environment, and due to its imaging nature, provided richer information. It may be applicable to other membrane receptors with the availability of fluorescent-tagged ligands.
Acknowledgements
The authors thank Ms Meilin SUN and Ms Hong YU for their technical assistance and suggestions.
References
- Cohen S. Isolation of a mouse submaxillary gland protein accelerating incisor eruption and eyelid opening in the new-born animal. J Biol Chem 1962;237:1555-62.
- Cohen S. The stimulation of epidermal proliferation by a specific protein (EGF). Dev Biol 1965;12:394-407.
- Nishida T, Nakamura M, Murakami J, Mishima H, Otori T. Epidermal growth factor stimulates corneal epithelial cell attachment to fibronectin through a fibronectin receptor system. Invest Ophthalmol Vis Sci 1992;33:2464-9.
- Maldonado BA, Furcht LT. Epidermal growth factor stimulates integrin-mediated cell migration of cultured human corneal epithelial cells on fibronectin and arginine-glycine-aspartic acid peptide. Invest Ophthalmol Vis Sci 1995;36:2120-6.
- Seger R, Yarden Y, Kashles O, Goldblatt D, Schlessinger J, Shaltiel S. The epidermal growth factor receptor as a substrate for a kinase-splitting membranal proteinase. J Biol Chem 1988;263:3496-500.
- Yarden Y, Ullrich A. Molecular analysis of signal transduction by growth factors. Biochemistry 1988;27:3113-9.
- Johnson GL, Lapadat R. Mitogen-activated protein kinase pathways mediated by ERK, JNK, and p38 protein kinases. Science 2002;298:1911-2.
- Widmann C, Gibson S, Jarpe MB, Johnson GL. Mitogen-activated protein kinase: conservation of a three-kinase module from yeast to human. Physiol Rev 1999;79:143-80.
- Ullrich A, Schlessinger J. Signal transduction by receptors with tyrosine kinase activity. Cell 1990;61:203-12.
- Schlessinger J. Cell signaling by receptor tyrosine kinases. Cell 2000;103:211-25.
- Weiner HL, Zagzag D. Growth factor receptor tyrosine kinases: cell adhesion kinase family suggests a novel signaling mechanism in cancer. Cancer Invest 2000;18:544-54.
- Aaronson SA. Growth factors and cancer. Science 1991;254:1146-53.
- Voldborg BR, Damstrup L, Spang-Thomsen M, Poulsen HS. Epidermal growth factor receptor (EGFR) and EGFR mutations, function and possible role in clinical trials. Ann Oncol 1997;8:1197-206.
- Knorr M, Schuller S, Steuhl KP, Thiel HJ. EGF in therapy of corneal diseases. Principles and possible uses. Ophthalmologe 1992;89:119-27. (in German).
- Tarnawski AS, Jones MK. The role of epidermal growth factor (EGF) and its receptor in mucosal protection, adaptation to injury, and ulcer healing: involvement of EGF-R signal transduction pathways. J Clin Gastroenterol 1998;27 Suppl 1:S12-20.
- Qian J, Voorbach MJ, Huth JR, Coen ML, Zhang H, Ng SC, et al. Discovery of novel inhibitors of Bcl-xL using multiple high-throughput screening platforms. Anal Biochem 2004;328:131-8.
- Dagogo-Jack S, Atkinson S, Kendall-Taylor P. Homologous radioimmunoassay for epidermal growth factor in human saliva. J Immunoassay 1985;6:125-36.
- Zhang JH, Chung TD, Oldenburg KR. A simple statistical parameter for use in evaluation and validation of high throughput screening assays. J Biomol Screen 1999;4:67-73.
- Ghosh RN, DeBiasio R, Hudson CC, Ramer ER, Cowan CL, Oakley RH. Quantitative cell-based high-content screening for vasopressin receptor agonists using transfluor technology. J Biomol Screen 2005;10:476-84.
- Osherov N, Gazit A, Gilon C, Levitzki A. Selective inhibition of the epidermal growth factor and HER2/neu receptors by tyrphostins. J Biol Chem 1993; 268: 11 134–42.
- Ding GJ, Fischer PA, Boltz RC, Schmidt JA, Colaianne JJ, Gough A, Characterization and quantitation of NF-kappaB nuclear translocation induced by interleukin-1 and tumor necrosis factor-alpha. Development and use of a high capacity fluorescence cytometric system. J Biol Chem 1998; 273: 28 897–905.
- Haskins JR, Rowse P, Rahbari R, de la Iglesia FA. Thiazolidinedione toxicity to isolated hepatocytes revealed by coherent multiprobe fluorescence microscopy and correlated with multiparameter flow cytometry of peripheral leukocytes. Arch Toxicol 2001;75:425-38.
- Plymale DR, Haskins JR, de la Iglesia FA. Monitoring simultaneous subcellular events in vitro by means of coherent multiprobe fluorescence. Nat Med 1999;5:351-5.
- Conway BR, Minor LK, Xu JZ, Gunnet JW, DeBiasio R, D’Andrea MR, et al. Quantification of G-protein coupled receptor internalization using G-protein coupled receptor–green fluorescent protein conjugates with the ArrayScan®trade mark high-content screening system. J Biomol Screen 1999;4:75-86.
