
Modeling resistance index of taxoids to MCF-7 cell lines using ANN together with electrotopological state descriptors1
Introduction
Paclitaxel (taxol, Bristol–Myers Squibb, New York, New York, USA[1]) and docetaxel (taxotere, Sanofi–Aventis, Paris, Paris, France[2]; Figure 1) are arguably two of the most effective and clinically successful anticancer agents widely used for the administration of several solid tumors, such as breast and ovarian cancers. Both agents have a unique anticancer mechanism known as microtubule-stabilizing activity. They act by accelerating the polymerization of tubulin and inhibiting the depolymerization of microtubules, thus leading to cell apoptosis[3–5]. Although both drugs possess strong antitumor activity, chemotherapy is usually limited by the presence of multidrug resistance (MDR). MDR is the cross-resistance of tumor cell lines to several structurally and functionally unrelated chemotherapeutic agents after exposure to a single cytotoxic drug[6,7]. Therefore, it is urgent to develop a new generation of anti-MDR taxoids.

Extensive research has been conducted to better understand the mechanism of MDR, and until now, several targets have been recognized to be associated with MDR, such as the overexpression of the ATP-binding cassette (ABC) transporter proteins and the mutations on tubulin[8,9]. The ABC transporter proteins include (but are not limited to) the P-glycoprotein, the multidrug resistance protein (MRP) 1, MRP2, and the breast cancer resistance protein[8]. For tubulin, it has been proven that the point mutation at the β-tubulin within or near the paclitaxel binding site and the expression of the β-tubulin isotypes, which are less sensitive to taxoid inhibition, usually lead to MDR[10]. For the complexity of the receptor targets relative to MDR, it is difficult to make use of receptor-based methods in exploring MDR problems. Since the last decade, a lot of taxoids have been synthesized, and their cytotoxicity activities to different cell lines have been evaluated, so we can now explore the problem of MDR from the perspective of ligands, that is, exploring the quantitative structure–activity relationship (QSAR) of taxoids and their anti-MDR activities. An important parameter in evaluating the anti-MDR activity of compounds is the resistance index (RI), which is the ratio of IC50 of the resistance cell lines to that of the sensitive ones.
Since the last decade, there has been a lot QSAR-based research about taxoids[11-15]. Most of these studies made use of 3-D methods, such as the comparative molecular field analysis (COMFA) or the comparative molecular similarity indices analysis (COMSIA); another character of these researches is that the activity they adopted is IC50 of taxoids to inhibit the disassembly of microtubule or growth of tumor cell lines instead of the RI of anti-MDR properties. MDR is a common and serious problem that hinders the application of taxoids; good IC50 activity alone can not satisfy the clinical demand. The next generation of taxoids should conquer the problem of MDR. Until now, we have found only 1 article that depicts the QSAR model of the RI. In this study, Monti et al adopted multilinear regression (MLR) to mimic the relationship between the RI and the structure of cis-platinum complexes. Four descriptors were adopted in their final models, and there are 16 compounds in the whole dataset[16]. As for taxoids, until now, there is no such model to predict the RI, so to obtain the RI, many cytotoxicity evaluation experiments should be conducted. Experimental methods are usually time and money consuming and they are not consistent with the basic drug development strategy of “fail early, fail cheap”[17,18], especially to millions of candidate molecules. So it is necessary for us to build a QSAR model to predict the RI for taxoids.
Molecular descriptors are one of the key factors to a successful QSAR model, and they should encode the most useful physicochemical information on structure features that are relative to the activities to be modeled. Electrotopological state (E-state) indices are widely used in QSAR modeling, including recent cancer-related research[19,20]. The large amount of variables in E-state indices can fully represent the structure characters of molecules, such as information about non-covalent interactions, which may be important to the occurrence of anti-MDR activity. The artificial neural network (ANN), used as a modeling technique, has recently become a popular and powerful chemometric tool[21-23]. Compared with classical statistical methods, ANN-based approaches do not require preliminary knowledge of the mathematical form of the relationship between the variables[24], which makes the ANN suitable for extrapolating the complex and unsure relationships between the biological phenomenon and the structure of the compounds. Several successful QSAR models in our previous studies have proven the feasibility of the combination of the E-state index and the ANN[20,25] to build models.
The purpose of this article was to build a QSAR model combining the E-state indices and the ANN to predict the RI for taxoids. Structure and cytotoxicity data of 63 taxoids, including paclitaxel and docetaxel, were collected from published studies[26-30]. Compared with the RI model of cis-platinum complexes, we enlarged the chemical space of our models by collecting 63 compounds synthesized by different laboratories at different times; moreover, more than 4 descriptors were adopted, and the ANN was used as a modeling technique as it does not have to suppose a linear relationship between structure and activity as in MLR. In order to determine the optimal composition of compounds in the training and validation sets, 5-fold cross-validation was performed. The robustness and generalization of our models were still evaluated by an external, independent testing set. The final model was statistically proven to be stable and predictive. This model will aid in filtering drug candidates and accelerate the design and development of new generation anti-MDR taxoids.
Material and methods
Dataset In order to build a reliable QSAR model, 63 taxoids with diverse structures were collected from published studies[26-30], which represented most of the structure modifications since the last decade to improve the clinical performance of paclitaxel and docetaxel. According to the modification positions, these compounds are categorized into 6 classes[31], as shown in Figure 2, and the substitution information of the compounds in each class are listed in Table 1. The data about the inhibitory effects (IC50) of these compounds to drug-sensitive human breast carcinoma (MCF-7S) and multidrug-resistant human breast carcinoma (MCF-7R) cell lines were also collected to calculate the RI. Cytotoxicity experiments were conducted following the same in vitro assay protocol developed by Skehan et al[32].The reason we chose MCF-7(S and R) cell lines was because they are widely used in biological activity evaluations of taxoids, which will aid in the collection of compounds. All the MCF-7R cell lines were induced by doxorubicin to ensure that they had the same MDR mechanisms. The anti-MDR activity of different taxoids was expressed as a relative value of the RI (taxoid)/RI (paclitaxel), and the values of –log (RI [taxoid]/RI [paclitaxel]) were used for analysis in the back propagation neural network (BPNN) model, which covered a large range, with nearly 3 orders of magnitude from –0.57 to +2.28.


Full table
The most reliable way to validate the generalization ability of a model is by external validation[33], that is, to assess the adequacy of the model by the dataset, which is not used in model building. So we randomly selected 14 compounds as an independent external testing set. Five-fold cross-validation was performed on the remaining 49 taxoids to evaluate the internal stability of models and to optimize the composition of compounds in the training and validation sets, so 49 compounds were randomly categorized into 5 groups. One group was selected as the validation set each time, and the remaining 4 groups as the training set; 5 different training and validation datasets could be used to construct different models[19]. The detailed grouping information of the datasets for each model together with the activities for each compound was given as supporting information.
Descriptor generation We used the Molconn-z program in the SYBYL software package (Tripos Associates, St Loius, MO, USA) to calculate molecular structure descriptors known as E-state indices, whose availability has been proven in a lot of QSAR models[20,34]. In total, 248 standard descriptors were calculated included in the molecular connectivity Chi indices, Kappa shape indices, E-state indices, hydrogen E-state indices, atom type and bond type E-state indices, topological equivalence indices and total topological index, counts of graph paths, atoms, atom types, bond types, and so on (Molconn-Z manual), which can sufficiently represent the structural characters of molecules. The E-state indices are shown to contain information reflecting the intermolecular accessibility of atoms and groups in a molecule, especially the electron accessibility, which is encoded into a numerical value. The advantage of these kinds of descriptors is that they encode not only the topological environment of an atom, but also the electronic interactions from other atoms in the molecules, as depicted in its formula[35]:
(1),
where Si is the E-state of atom i, Ii is the intrinsic state, and dIi is the perturbations due to the atoms around it. Moreover, most of the descriptors have been proven to be well associated with non-covalent interactions, which are important for bioactivity[36]. Thus, E-state indices can represent the structure information, which may also be relative to the anti-MDR properties for taxoids.
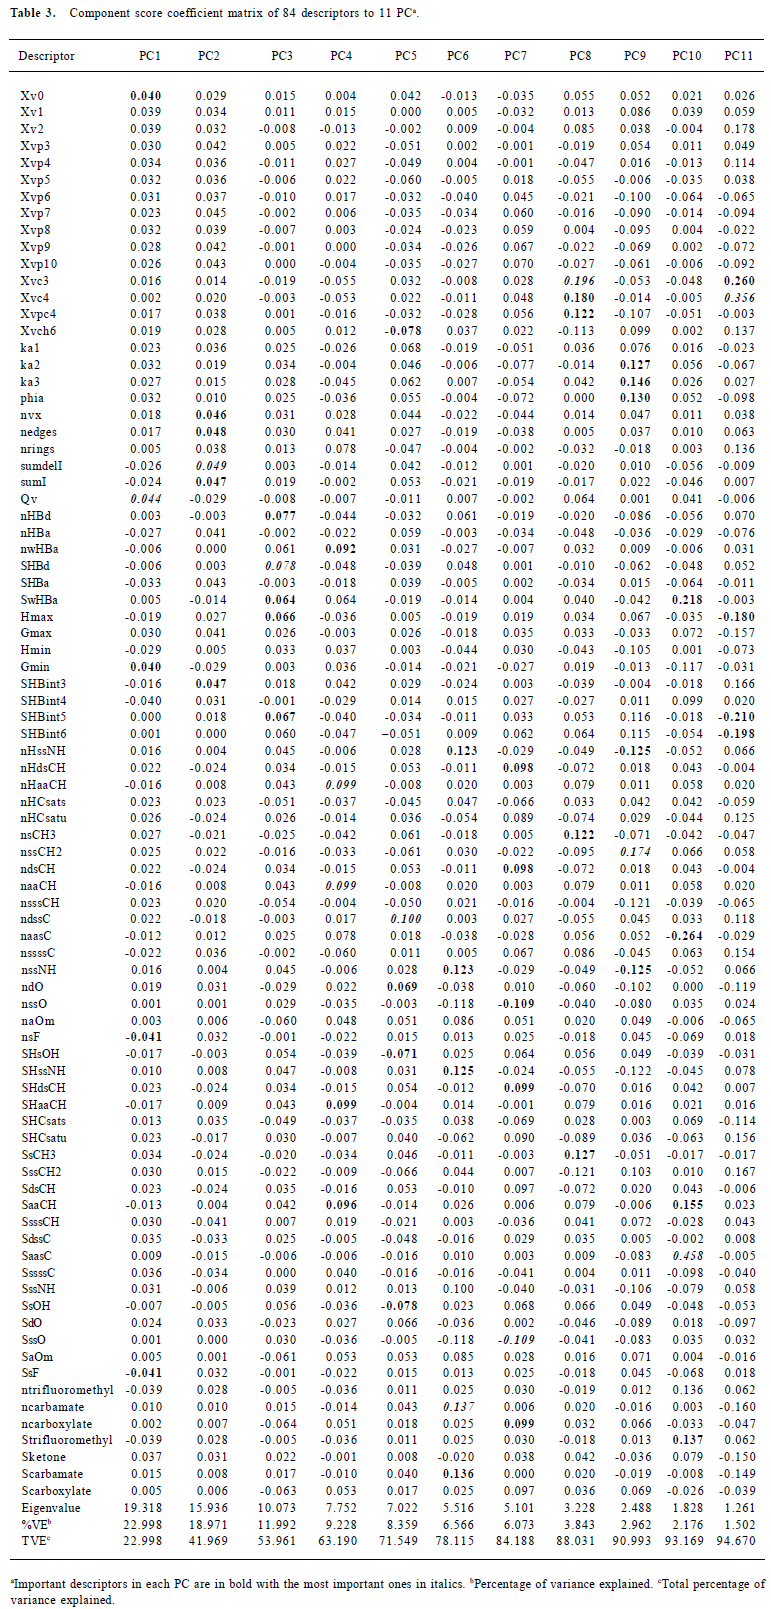
Feature reduction Not all of the 248 descriptors contribute to the bioactivity; some measures were taken to eliminate the noise (uninformative descriptors): eliminating the descriptors with constant values and more than 90% zero values because they offered little discriminating information for the construction of model. After this procedure, 84 descriptors remained, as shown in Table 2. In order to further reduce the variable space and the chance of correlation between the descriptors, a principle component analysis (PCA) was performed on the remaining 84 variables. The 11 derived principle component vectors (PC) were used for model building. The calculation of PCA was done by free data mining software, Tanagra 1.1 (http://eric.univ-lyon2.fr/~ricco/tanagra/en/tanagra.html).

Full table
ANN In order to build reliable and predictive QSAR models, we adopted the ANN technique, which has been proven to have outstanding non-linear approximation ability[22,23,37]. A typical ANN consists of an input layer, a hidden layer, and an output layer. In the ANN, signals are propagated from the input neurons through the hidden layer to the output neuron, and then the error is calculated and back propagated to iteratively adjust weights and biases in order to minimize the error in prediction; this is the most distinct character of typical back propagation (BP) algorithm.
The ANN program used was the neural network software package of MATLAB 7.0.1 developed by Math Works (Natick, MA, USA). Some fully connected 3-layer BP neural networks with sigmoid transfer function were constructed. The number of neurons in the input layer equaled the number of PC. Before the net training, all of the input and output values were normalized to between –1 and 1, and the outputs were transferred back to the same units as the original outputs for comparison purpose. The Levenberg–Marquardt algorithm was adopted to optimize weights and biases because it was significantly faster than other algorithms based on gradient descent[38]. In each of the 5 different datasets, the training sets were used to determine the architecture of the ANN model; the validation sets were adopted to tune the ANN parameters to prevent overtraining[39], and the independent external testing set was used to evaluate the predictive ability of the models. In order to determine the optimal number of neurons in the hidden layer, we adopted some empirical rules. For example, the number of neurons in the hidden layer can be confirmed by the formula: m=log2 n+α, where m is the number of neurons in hidden layer, n is the number of input variables, and α is the integer between 0 and 10[40–42]. The early-stopping method was adopted to help prevent overtraining. For the 5 datasets with different compounds in the training and validation sets, we trained the models separately.
Model evaluation The following parameters were calculated to evaluate the performance of the ANN and the predictive ability of the model: Q2cv (cross-validation correlation coefficient), RMSE (residual mean square error), R2 (square correlation coefficients for the regression line for calculated and experimentally-derived activity of the external testing set), R02 (square correlation coefficients for the regression line through the origin for calculated and experimentally-derived activity of the external testing set), and K (the slope of regression line through the origin for testing sets). The residuals between the predicted and experimentally-derived activities were also calculated for the best model. The definitions of Q2cv[43] and RMSE[33] are listed below:
(2)
(3),
where PRESS is the sum of squared deviations between the predicted and measured biological activity values for each compound in the validation set, and SD is the sum of the squared deviations between the measured activities of the compounds in the validation set and the mean activity of the training set compounds. and are the predicted and actual activities, respectively, and corresponds to the equation of regression . The propositional criteria necessary for the high predictive ability of a model are high Q2cv (at least >0.5), high R2 for the external testing set (at least >0.6), (R2-R02)/R2<0.1, and 0.85 ≤K ≤1.15[33,47].
Results
Molecular descriptors The remaining 84 molecular descriptors after the feature reduction were compressed and analyzed by PCA, resulting in 11 PC for network building. The number of components was determined by the maximum variance described by the PC and the eigenvalues. Eleven PC were sufficient to explain nearly 95% of the variance, and all of their eigenvalues were greater than 1. The coefficients of variables to each PC are described in Table 3. PC1 and PC2 explained 23% and 19% of the total variance, respectively. In each, the molecular connectivity and molecular shape indices played important parts. The PC2 mainly consists of the E-state descriptors, which encode the topological and the electronic information about each atom and the interaction deriving from the environment. PC3, with 10% of the variances explained, represents the information of the H-bond interaction derived from the information about the H-bond donor and acceptors. PC4 was dominated by the information about the atom type aaCH:, that is,:CH:, including the number of atoms of this kind, number of H on these atoms, and the total E-state values and HE-state values, and it encodes 9.23% of the variance. The most important descriptor in PC5 is the ndssC, which counts the number of atoms of this kind =C<. Interestingly, the atom O descriptor also accounts for a large part in PC5, which totally depicted 8.4% of the total variance. Although only 6.6% of the variance was explained, PC6 contained important descriptors, mainly about the atom N, such as NH– and the group NC (=O) OR. The remaining 5 PC can contribute to 16.6% of the total variance and each one was dominated by important descriptors.
Full table
QSAR modeling As for the 5 different training and validation sets, 5 QSAR models were built separately. Eleven PC served as input variables for each model. There are no rigorous theoretical principles for determining the structure for ANN, so different numbers of neurons in the hidden layer and various numbers of epochs were tried in order to prevent overfitting and overtraining. As weights and biases are optimized by the back propagation iterative procedure, training errors typically decrease, but validation errors first decrease and subsequently begin to rise, revealing a progressive worsening of the generalization ability of the network. Thus, when RMSE (transferred back) for training and validation sets both reached comparatively small values, the optimized number of neurons and epochs was confirmed. After the structure of the ANN was chosen, repeated training was done to optimize the weights and biases to find the best predictive models. The architecture of each model and the results of the cross-validation Q2cv and RMSE (T, V) are summarized in Table 4.

Full table
Model evaluation The external independent testing set composing of 14 compounds was used to evaluate the predictive ability of the 5 models with the results shown in Table 5. Although the Q2cv values of model 3 was >0.5, and both the values of RMSET and RMSEV were less (0.003), the generalization ability of this model is poor, as demonstrated by the results of R02 and the values of (R2–R02)/R2. The statistical results of model 4 also did not satisfy the criteria for a good model. Although the evaluation results of models 1, 2, and 5 all satisfied the referred criteria necessary for predictive models, we selected model 2 as our final model as it had the highest value of Q2cv and R2, allowing us to determine the most stable and predictive model for the RI.

Full table
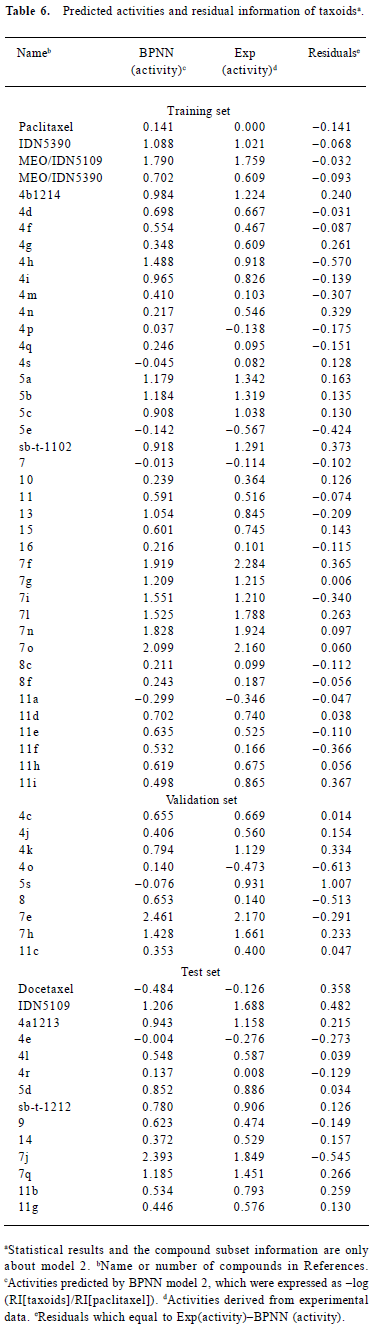
The residuals between the predicted and experimentally-derived activities for compounds in the training, validation, and prediction sets by model 2 are shown in Table 1. We can see that the activities of all 63 taxoids were predicted within 1.007 log units of their experimentally-derived activities with an average absolute error of 0.213 log units (Table 6). The predictive results of all 63 compounds are plotted in Figure 3. The statistical results of the testing set found that the greatest deviation was 0.54 log units with an average absolute error of 0.226 log units. The predicted results are also plotted in Figure 4.
Full table


Discussion
A successful descriptor should represent the key structure information of molecules, influences activity, and then can be useful in the prediction of activity for unknown compounds. According to some structure activity studies[26–30], substitution by definite atoms or groups can influence anti-MDR activity; for example, F-substituted taxoids at different positions usually alter the anti-MDR activity differently, and the –OH and groups including N atoms also play an important part in the change of activity. As discussed earlier, the E-state indices had fully encoded these kinds of structure information; for example, F, N, =C< and:CH: descriptors were all embodied in different PC. Moreover, the reported mechanisms about MDR of taxoids are relative to ABC transporter proteins and tubulin[10]. As for ABC transporter proteins, intermolecular H bonds are key factors for the recognition of taxoids by those proteins[25]. For tubulin, it has been proven that specific conformation, such as the T- taxol for taxoids, should be maintained, and taxoids can act on some definite isotypes of tubulin, which are also relative to the non-covalent interaction intra or inter molecules[44–46]. So maybe the anti-MDR activities of taxoids have some relationship to non-covalent interactions. Topological-based E-state indices comprised H-bond descriptors for inter and intra molecules, which represented the non-covalent interactions. According to the above analysis, we can see that E-state indices can represent important attributes of molecular structure, especially those associated with the interaction between taxoids and receptors. So it seems reasonable for us to choose E-state indices as our descriptors for exploring the relationship between the RI and the structure.
As for the statistical results of the 5 ANN models, although each model was with the good internal cross-validation results(Q2cv>0.5), we can’t conclude that all of them have good generalization abilities. The results of model 3 indirectly indicated that only the independent external testing rather than the internal validation could evaluate the predictive ability of a model. The results of 5-fold cross-validation and external testing also ensured that the compound composition of the training and validation sets had important influence on the architecture and performance of models, especially on the predictive ability for the external testing sets. Five-fold cross-validation could help us to find out the optimal combination of compounds that may be useful for obtaining the most predictive model.
According to the results of model 2, in Figure 3, all of the samples distributed closely around the line, and the value of R02 was 0.8936, together with the K (the slope of regression line through the origin) was 1.0137, which further proved the closeness of the predicted and experimentally-derived activity. The results also indicated that the E-state indices did correlate well with the –log (RI/P). The statistical results of the testing set further confirmed the predictive ability of this model.
As for the complexity of the receptor proteins associated with MDR, we derived a ligand-based QSAR model to predict the values of the RI for different taxoids. E-state indices were used to represent the structure of molecules; BPNN was used to explore the relationship between descriptors and RI activity. During the construction of the models, 5-fold cross-validation was performed to determine the best composition of compounds in the training and validation sets. The predictive ability of the models was also evaluated by an independent testing set. The best model had the statistical results of R2=0.84, R02=0.835, K=0.9933, and RMSEP=0.014, indicating the excellent robustness and generalization of our model. The results also proved that E-state indices have some relationship to anti-MDR activity, and the BPNN modeling technique can fully emulate this kind of non-linear relationship. Our model can predict the values of the RI for taxoids just from its structure even before it was synthesized, so it will aid in the filter of anti-MDR drug candidates and accelerate the design and development of taxoids with good clinical performance to drug resistance cell lines.
References
- Wani MC, Taylor HL, Wall ME, Coggon P, McPhail AT. Plant antitumor agents. VI. Isolation and structure of taxol, a novel antileukemic and antitumor agent from Taxus brevifolia. J Am Chem Soc 1971;93:2325-7.
- Gueritte-Voegelein F, Guenard D, Mangatal L, Potier P, Guilhem J, Cesario M, et al. Structure of a synthetic taxol precursor: N-tert-butoxycarbonyl-10-deacetyl-N-debenzoyltaxol. Acta Crystallogr C 1990;46:781-4.
- Kingston DGI. Recent advances in the chemistry of taxol. J Nat Prod 2000;63:726-34.
- Miller ML, Ojima I. Chemistry and chemical biology of taxane anticancer agents. Chem Rec 2001;1:195-211.
- Kingston DGI, Newman DJ. Taxoids: cancer-fighting compounds from nature. Curr Opin Drug Discov Devel 2007;10:130-44.
- Edwards P. Peptoid positional scanning libraries for identification of multidrug resistance reversal agents. Drug Discov Today 2006;11:669-70.
- Burchenal JH, Holmberg EA. The utility of resistant leukaemias in screening for chemotherapeutic activity. Ann N Y Acad Sci 1958;76:826-9.
- Leslie EM, Deeley RG, Cole SPC. Multidrug resistance proteins: role of P-glycoprotein, MRP1, MRP2, and BCRP (ABCG2) in tissue defense. Toxicol Appl Pharmacol 2005;204:216-37.
- Orr GA, Verdier-Pinard P, McDaid H, Horwitz SB. Mechanisms of taxol resistance related to microtubules. Oncogene 2003;22:7280-95.
- Ojima I, Ferlini C. New insights into drug resistance in cancer. Chem Biol 2003;10:583-4.
- Cunningham SL, Cunningham AR, Day BW. CoMFA, HQSAR and molecular docking studies of butitaxel analogues with beta-tubulin. J Mol Model 2005;11:48-54.
- Czaplinski KHA, Grunewald GL. A comparative molecular-field analysis derived model of the binding of taxol analogs to microtubules. Bioorg Med Chem Lett 1994;4:2211-6.
- Mohanraj S, Doble M. 3-d QSAR studies of microtubule stabilizing antimitotic agents towards six cancer cell lines. QSAR Comb Sci 2006;25:952-60.
- Pineda O, Farras J, Maccari L, Manetti F, Botta M, Vilarrasa J. Computational comparison of microtubule-stabilising agents laulimalide and peloruside with taxol and colchicine. Bioorg Med Chem Lett 2004;14:4825-9.
- Roy K, Pal DK, De AU, Sengupta C. Hansch analysis of anticancer activities of C-2-modified paclitaxel analogs against human ovarian carcinoma 1A9, human colon carcinoma HCT116 and human Burkitt lymphoma CA46 cell lines. Indian J Chem Sect B-Org Chem Incl Med Chem 1999;38:1194-202.
- Monti E, Gariboldi M, Maiocchi A, Marengo E, Cassino C, Gabano E, et al. Cytotoxicity of cis-platinum (II) conjugate models. The effect of chelating arms and leaving groups on cytotoxicity: A quantitative structure–activity relationship approach. J Med Chem 2005;48:857-66.
- van de Waterbeemd H, Gifford E. ADMET in silico modelling: Towards prediction paradise? Nat Rev Drug Discov 2003;2:192-204.
- Yu HS, Adedoyin A. ADME-Tox in drug discovery: integration of experimental and computational technologies. Drug Discov Today 2003;8:852-61.
- Helguera AM, Rodriguez-Borges JE, Garcia-Mera X, Fernandez F, Natalia M, Cordeiro DS. Probing the anticancer activity of nucleoside analogues: A QSAR model approach using an internally consistent training set. J Med Chem 2007;50:1537-45.
- Wang YH, Li Y, Li YH, Yang SL, Yang L. Modeling K-m values using electrotopological state: Substrates for cytochrome P450 3A4-mediated metabolism. Bioorg Med Chem Lett 2005;15:4076-84.
- Habibi-Yangjeh A, Danandeh-Jenagharad M, Nooshyar M. Application of artificial neural networks for predicting the aqueous acidity of various phenols using QSAR. J Mol Model 2006;12:338-47.
- Siu FM, Che CM. Quantitative structure–activity (affinity) relationship (QSAR) study on protonation and cationization of alpha-amino acids. J Phys Chem A 2006; 110: 12 348–54.
- Su Q, Zhou L. QSAR modeling of AT1 receptor antagonists using ANN. J Mol Model 2006;12:869-75.
- Aoyama T, Suzuki Y, Ichikawa H. Neural networks applied to pharmaceutical problems. III. Neural networks applied to quantitative structure–activity relationship (QSAR) analysis. J Med Chem 1990;33:2583-90.
- Wang YH, Li Y, Yang SL, Yang L. Classification of substrates and inhibitors of P-glycoprotein using unsupervised machine learning approach. J Chem Inf Model 2005;45:750-7.
- Barboni L, Ballini R, Giarlo G, Appendino G, Fontana G, Bombardelli E. Synthesis and biological evaluation of methoxylated analogs of the newer generation taxoids IDN5109 and IDN5390. Bioorg Med Chem Lett 2005;15:5182-6.
- Ojima I, Inoue T, Chakravarty S. Enantiopure fluorine-containing taxoids: potent anticancer agents and versatile probes for biomedical problems. J Fluor Chem 1999;97:3-10.
- Ojima I, Kuduk SD, Pera P, Veith JM, Bernacki RJ. Synthesis and structure-activity relationships of nonaromatic taxoids: Effects of alkyl and alkenyl ester groups on cytotoxicity. J Med Chem 1997;40:279-85.
- Ojima I, Slater JC, Michaud E, Kuduk SD, Bounaud PY, Vrignaud P, et al. Syntheses and structure-activity relationships of the second-generation antitumor taxoids: Exceptional activity against drug-resistant cancer cells. J Med Chem 1996;39:3889-96.
- Ojima I, Wang T, Miller ML, Lin SN, Borella CP, Geng XD, et al. Synthesis and structure-activity relationships of new second-generation taxoids. Bioorg Med Chem Lett 1999;9:3423-8.
- Zhu QQ, Guo ZR, Huang N, Wang MM, Chu FM. Comparative molecular field analysis of a series of paclitaxel analogues. J Med Chem 1997;40:4319-28.
- Skehan P, Storeng R, Scudiero D, Monks A, McMahon J, Vistica D, et al. New colorimetric cytotoxicity assay for anticancer-drug screening. J Natl Cancer Inst 1990;82:1107-12.
- Golbraikh A, Tropsha A. Beware of q2!. J Mol Graph Model 2002;20:269-76.
- Kier LB, Hall LH. The prediction of ADMET properties using structure information representations. Chem Biodivers 2005;2:1428-37.
- Hall LH, Kier LB. Electrotopological state indexes for atom types––a novel combination of electronic, topological, and valence state information. J Chem Inf Comput Sci 1995;35:1039-45.
- Hall LH, Kier LB. The E-state as the basis for molecular structure space definition and structure similarity. J Chem Inf Comput Sci 2000;40:784-91.
- Votano JR, Parham M, Hall LM, Hall LH, Kier LB, Oloff S, et al. QSAR modeling of human serum protein binding with several modeling techniques utilizing structure-information representation. J Med Chem 2006;49:7169-81.
- Hagan MT, Menhaj MB. Training feedforward networks with the Marquardt algorithm. Neural Networks IEEE Transactions on 1994;5:989-93.
- Tetko IV, Livingstone DJ, Luik AI. Neural-network studies .1. Comparison of overfitting and overtraining. J Chem Inf Comput Sci 1995;35:826-33.
- Berry MJA, Linoff G. Data mining techniques. NY: John Wiley & Sons; 1997.
- Han LQ. The principle, design and application of artificial neural network. Beijing: Chemical Industry Publishing Company; 2002.
- Chen LJ, Lian GP. Prediction of human skin permeability using artificial neural network (ANN). Acta Pharmacol Sin 2007;28:591-600.
- Cramer RD, Patterson DE, Bunce JD. Comparative molecular field analysis (CoMFA). 1. Effect of shape on binding of steroids to carrier proteins. J Am Chem Soc 1988;110:5959-67.
- Ganesh T, Yang C, Norris A, Glass T, Bane S, Ravindra R, et al. Evaluation of the tubulin-bound paclitaxel conformation: Synthesis, biology, and SAR studies of C-4 to C-3' bridged paclitaxel analogues. J Med Chem 2007;50:713-25.
- Snyder JP, Nettles JH, Cornett B, Downing KH, Nogales E. The binding conformation of taxol in beta-tubulin: a model based on electron crystallographic density. Proc Natl Acad Sci USA 2001;98:5312-6.
- Vander Velde DG, Georg GI, Grunewald GL, Gunn CW, Mitscher LA. “Hydrophobic collapse” of taxol and taxotere solution conformations in mixtures of water and organic solvent. J Am Chem Soc 1993; 115: 11 650–1.
- Tropsha A, Gramatica P, Gombar VK. The importance of being earnest: validation is the absolute essential for successful application and interpretation of QSPR models. QSAR Comb Sci 2003;22:69-77.