Synergistic effect of combining paeonol and cisplatin on apoptotic induction of human hepatoma cell lines1
Introduction
Hepatocellular carcinoma (HCC) is a major contributor to cancer incidence and mortality in the world. The incidence of HCC is rising worldwide and 80% of the burden is borne by countries in Asia and sub-Saharan Africa[1]. Despite recent advances in diagnostic modalities for HCC, the disease often develops to an advanced stage before it is detected clinically, and 5 year survival is less than 10%[2,3]. No effective treatment is currently available. Therefore, there is a critical need to develop more effective strategies for the chemotherapy of hepatoma.
Chemotherapy is one of the commonly used strategies in HCC treatment, especially for unresectable patients. Conventional chemotherapeutic drugs such as cisplatin (CDDP), adriamycin, and 5-fluorouracil (5-FU) often have severe side effects that limit their efficacy. Combination therapy with multiple drugs or modalities is a common practice in the treatment of cancers, which can achieve therapeutic effects greater than those provided by a single drug or modality, and can reduce the side effects and resistance to drugs.
Chinese herbal medicines are now attracting great attention in the world. They have also shown promising effects when combined with chemotherapy and may benefit patients with HCC[4]. Paeonol (Pae), a major active component extracted from the herb Pycnostelma paniculatum (Bunge) K Schum, and the root cortex of Paeonia suffruticosa And-rews[5], possesses extensive pharmacological activities such as sedation, hypnosis, antipyresis, analgesic, anti-oxidation, anti-inflammation, and immunoregulation[6]. It is a white needle crystal with a relatively low-melting point of 51–52 °C and has a minimal systemic toxicity (LD50 3430 mg/kg) when orally administered to mice[7]. In our previous study, the antineoplastic activity of Pae has been demonstrated both in cell lines, such as the human erythromyeloid cell line K562, the breast cancer cell line T6-17, the human hepatoma cell line Bel-7404, and cervical cancer cell line HeLa[8], and in animal models bearing HepA hepatocarcinoma[9,10]. A recent study showed that Pae in low concentration had synergetic effect with 5-FU, mitomycin C, and CDDP in inhibiting the proliferation of human colorectal cancer cell line HT-29[11].
The present study was designed to investigate the growth-inhibitory and apoptosis-inducing effect of Pae alone or combined with CDDP in order to develop an effective combination therapy for HCC.
Materials and methods
Cell culture Human hepatoma cells HepG2 and SMMC-7721 were purchased from Shanghai Institute of Hepatocarcinoma (Shanghai, China), and cultured in Dulbecco’s modified Eagle’s medium (DMEM) and RPMI-1640 medium, respectively. Each was supplemented with 10% fetal bovine serum (FBS) and incubated at 37 °C in a humid atmosphere with 5% CO2.
Drugs and chemicals The Pae injection was purchased from First Pharmaceutical Factory of Shanghai (Shanghai, China, Cat N
In vitro cytotoxicity assay HepG2 and SMMC-7721 cells were seeded in 96-well plates at a density of 1×10³–5×10³ cells/well in 100 µL medium overnight. Then the cells were treated with various concentrations of Pae or CDDP alone or in combination. After drug exposure for 44 h, the MTT solution (5 g/L) was added to the plates. The cells were incubated at 37 °C for another 4 h. The formazan was dissolved in 150 µL/well DMSO, and the absorbance was detected at 490 nm using the ELx800 Strip Reader (Bio-Tek, Winooski, VT, USA). All MTT experiments were performed in triplicate and repeated at least 3 times. The percentage of cytotoxicity was calculated as follows: cytotoxicity (%)=(1–OD490 of experimental well)/OD490 of control well. The IC50 (defined as the drug concentration with which 50% cell growth was inhibited) was assessed from the dose-response curves.
Analysis of in vitro drug interaction The coefficient of drug interaction (CDI) was used to analyze the synergistically inhibitory effect of the drug combination[12]. CDI was calculated as follows: CDI=AB/(A×B). AB is the ratio of the 2-drug combination group to the control group in OD490, and A or B is the ratio of the single drug group to the control group in OD490. Therefore, CDI <1 indicates synergism, CDI <0.7 indicates a significantly synergistic effect, CDI =1 indicates additivity, and CDI >1 indicates antagonism.
AO fluorescence staining The cells were cultured overnight in 6-well plates containing cover slips. After treatment for 24 h, the cover slips were washed twice with PBS and fixed with 95% ethanol for 15 min. After being acidified with 1% acetic acid for 30 s, the cover slips were dyed with 0.1 g/L AO for 10 min. Then the slips were differentiated with 0.1 mol/L CaCl2 for 2 min and washed with PBS 3 times. Finally, the cover slips were sealed and observed under fluorescence microscope (Olympus, Shinjuku-ku, Tokyo, Japan).
Flow cytometry assay The cells were cultured in 6-well plates and allowed to grow to 75%–80% confluency, in triplicate. Non-adhered cells were removed by gentle washing, and the medium was removed and replaced with fresh medium containing Pae and/or CDDP at the desired concentrations. After exposure to drugs for 24 h, the cells were collected and centrifuged at 1500 r/min in a 15 mL tube for 10 min. The cells were washed twice with PBS and resuspended in 50 µL DNA- Prep LPR (Lyse) at room temperature for 20 s. After that, 500 µL DNA-Prep Stain (propidium iodide+RNAse) was added and incubated in darkness at room temperature for 30 min (according to the procedure program of DNA-Prep Coulter Reagents Kit). A minimum of 1×10⁶ cells treated for each group were analyzed using an EPICS XL-MCL model Coulter counter (Beckman Coulter, Fullerton, CA, USA). Cell cycle distribution was analyzed using MacCycle software (Beckman Coulter, Fullerton, CA, USA).
Immunohistochemical analysis for Bcl-2 and Bax The cells were cultured overnight in 6-well plates containing cover slips. After incubation with various concentrations of Pae or CDDP alone or in combination for 24 h, the cover slips were washed twice with PBS and fixed in 4% paraformaldehyde for 25 min. Immunohistochemical staining for Bcl-2 and Bax was performed according to the standard S-P method described in the procedure program of the S-P Reagents Kit (Maxim, Fuzhou, Fujian, China). PBS 10 mmol/L was used as a negative control to replace the primary antibody.
Analysis of immunohistochemical results The immunohistochemical results were quantitatively analyzed by the Biological Image Analysis System (Yokohama, Kanagawa, Japan) which consisted of a Nikon ECLIPSE 80i biology microscope, Nikon Digital Camera DXM 1200F, and ACT-1 version 2.63 software (Yokohama, Kanagawa, Japan), and JEOA 801D Morphologic Biological Image Analysis software, version 6.0 (Jie Da Technologies, Nan-jing, Jiangsu, China). The sample was observed on 6 randomly-selected optical fields by microscopy (×400), and an average A value was measured.
Date analysis Biostatistical analyses were done using SPSS 11.5 software package (SPSS, Chicago, Illinois, USA). The results of representative experiments are given as mean±SD, and mean±SEM for multiple experiments. The non-parametric Kruskal-Wallis test was used to detect differences among the different experimental groups. The Mann-Whitney U-test was subsequently used for statistical evaluation in 2-group comparisons. Pearson correlation coefficient was used to analyze continuous independent and dependent variables. A level of P<0.05 was accepted as statistically significant.
Results
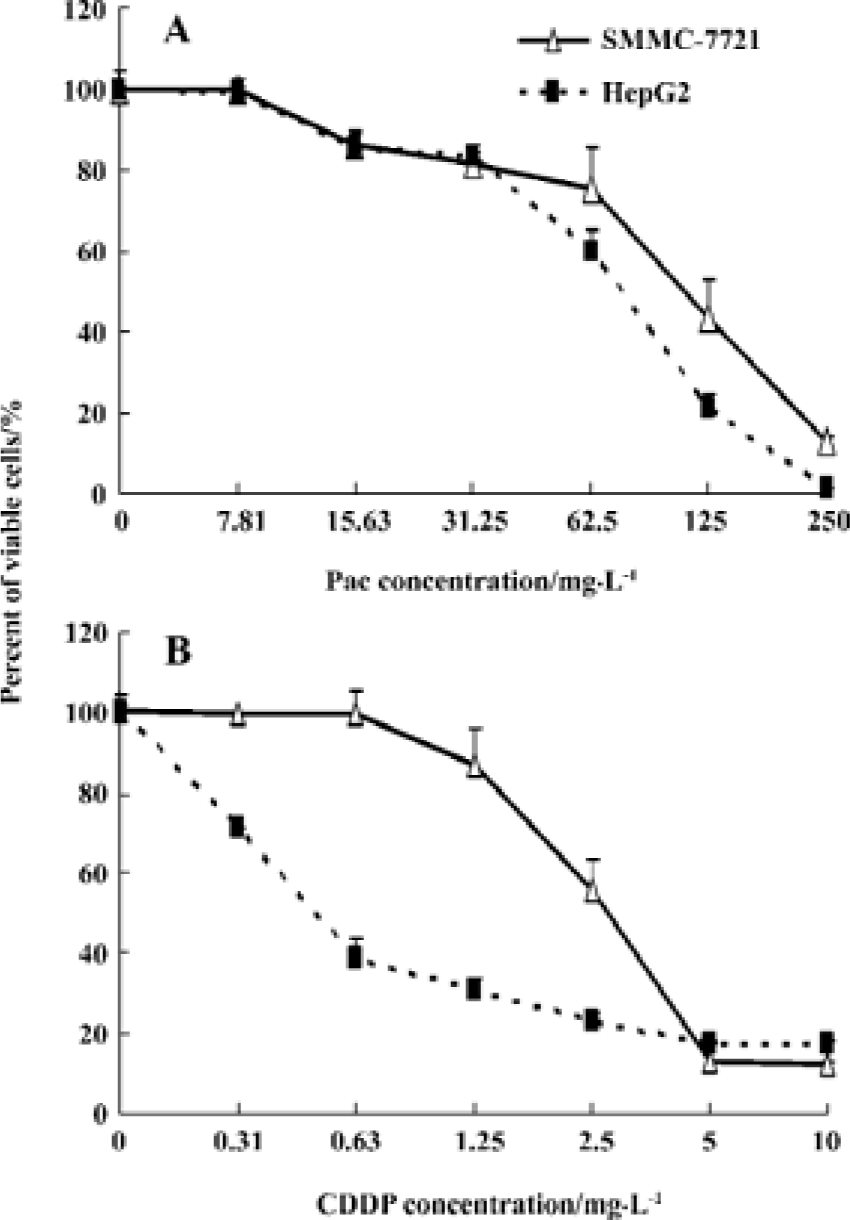
Inhibitory effect of Pae and CDDP on hepatoma cell proliferation HepG2 and SMMC-7721 cells incubated with various concentrations of Pae or CDDP alone for 48 h showed a dose-dependent reduction of cell viability (Figure 1). The r values of the dose-effect curves for single-agent Pae on both HepG2 and SMMC-7721 cell lines were 0.959 and 0.984 (P<0.01), respectively. Similarly, the r values for CDDP were 0.924 and 0.949 (P<0.01), respectively. However, the sensitivity of the cells to Pae and CDDP was considerably different. The cells were more sensitive to CDDP than to Pae, when comparing the IC50 of CDDP to that of Pae. The IC50 of Pae on HepG2 and SMMC-7721 cells was [104.77±7.26, 95% confident limits (CI): 86.74–122.80 and (128.47±9.29) (95% CI: 113.69–143.25 mg/L], respectively (Figure 1A), which was much more than that of CDDP (0.584±0.060, 95% CI: 0.443–0.726 mg/L) and 2.889±0.204 (95% CI: 2.380–3.398 mg/L) as shown in Figure 1B.
Synergistic cytotoxicity of Pae combined with CDDP To investigate the synergistic inhibitory effects of Pae and CDDP, 3 doses of Pae (15.63, 31.25, and 62.5 mg/L) were used in combination with different concentrations of CDDP mixed at a fixed ratio (1:1, v/v). The results showed that Pae increas-ed the cytotoxicity of CDDP on HepG2 and SMMC-7721 cells. For example, in the presence of 15.63, 31.25, and 62.5 mg/L Pae, the IC50 of CDDP reduced from 0.584±0.060 mg/L to 0.366±0.011, 0.161±0.018, and 0.007±0.002 mg/L, respectively for HepG2 cells (P<0.01, Figure 2A).
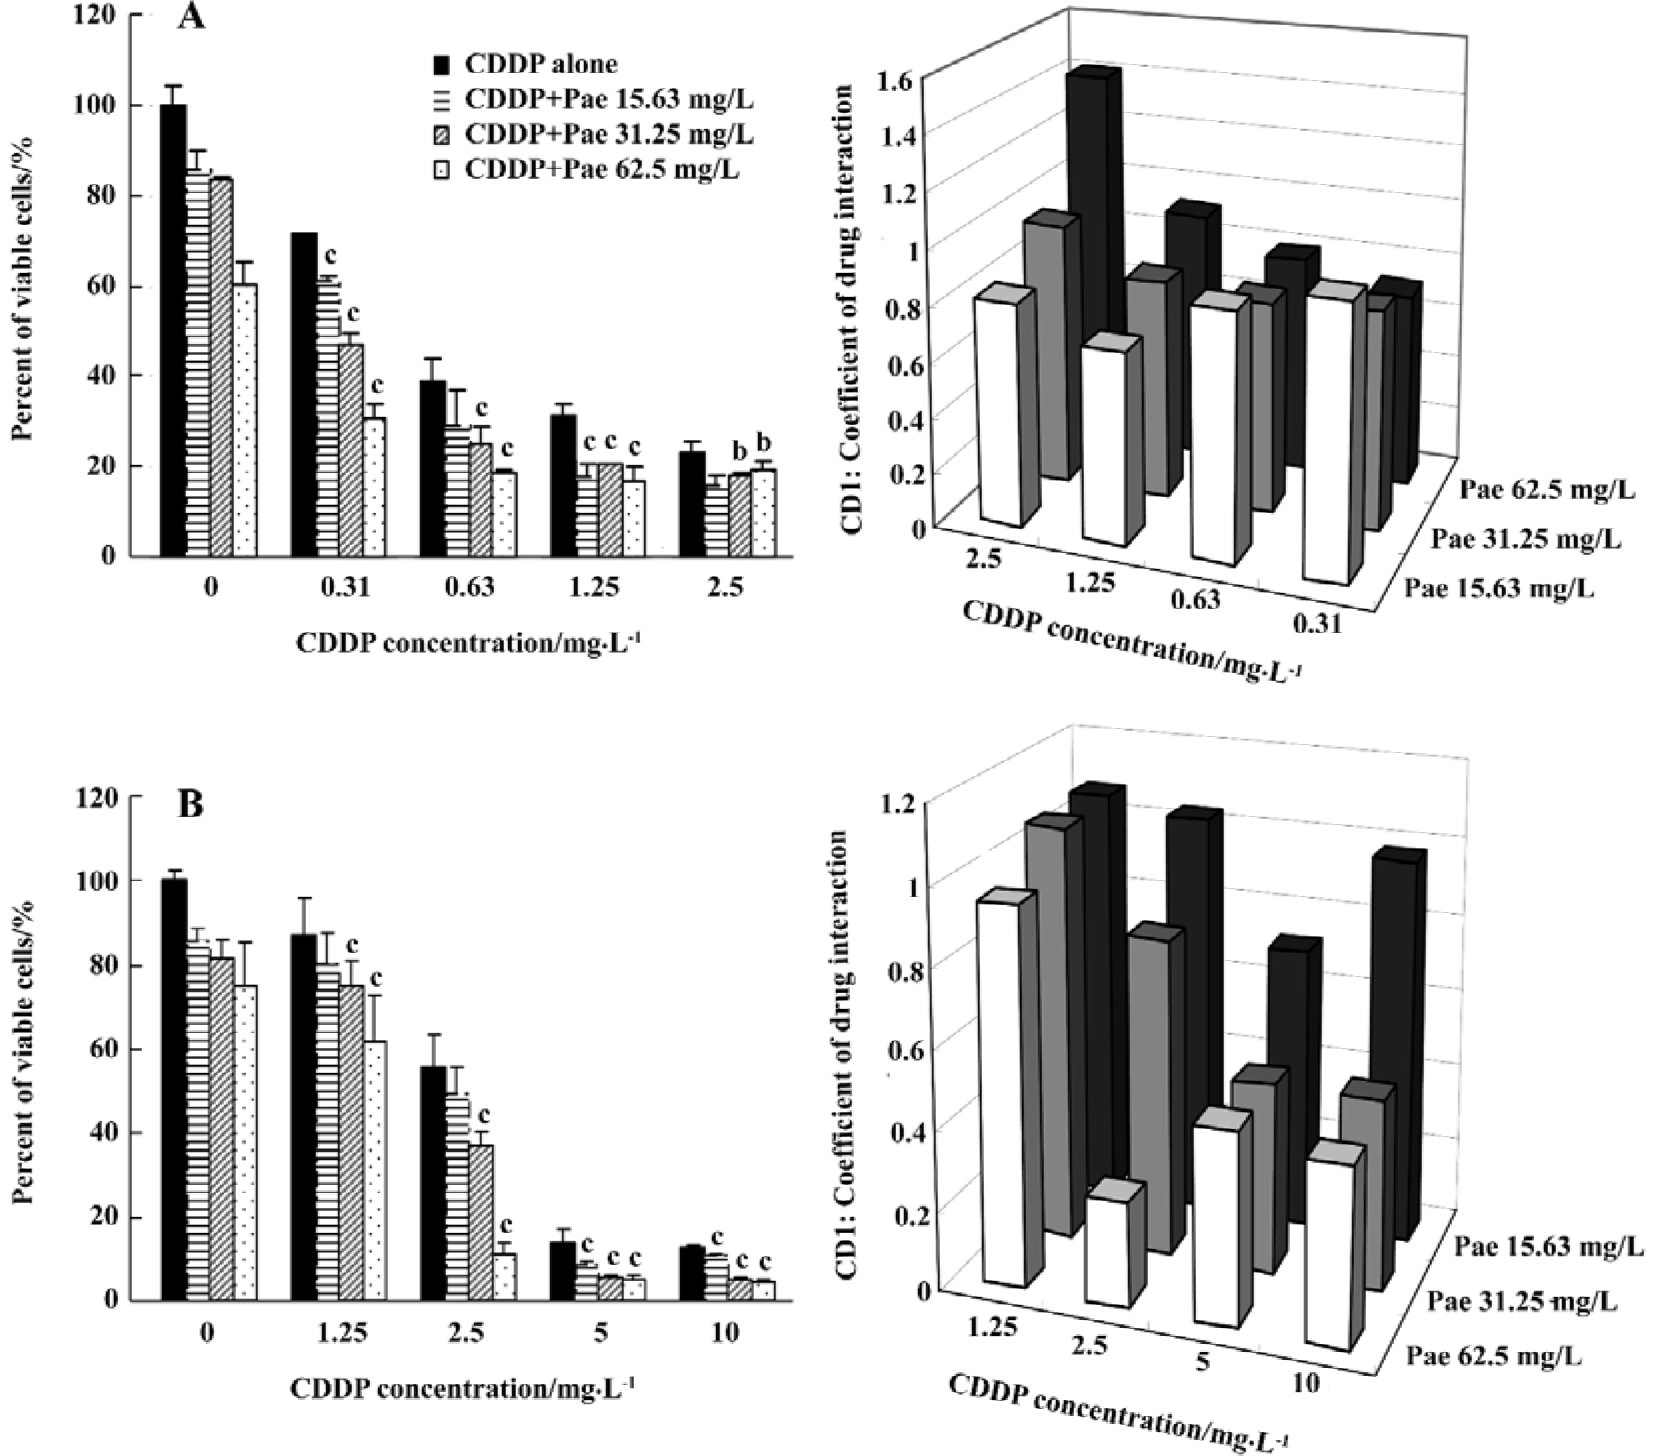
CDI was used to evaluate the nature of the interaction. There are 2 situations (CDI < or =0.7) shown in Figure 2A under which the combination makes sense in HepG2 cells. One is the combination of 0.31 mg/L CDDP with 62.5 mg/L Pae; the other is the combination of 1.25 mg/L CDDP with 15.63 mg/L Pae. Unexpectedly, the synergistic inhibitory effects of Pae and CDDP on SMMC-7721 cells required a large amount of those two agents (Figure 2B) which had the strongest synergism when 62.5 mg/L Pae was combined with 2.5 mg/L CDDP. This suggests that the synergistic inhibitory effects of Pae and CDDP depend on cell lines.
Cell apoptosis induced by Pae and CDDP We then examined whether the synergistic effect of Pae combined with CDDP also applied to the induction of apoptosis. All cells incubated with AO had green nuclei and yellow chromatin. Both of the 2 cell lines treated with Pae and CDDP showed typically apoptotic changes, such as chromatin condensation and deformed and fragmented nuclei, especially in the combination groups (Figures 3A, 4A). The ratio of apoptosis of 500 cells was calculated. In HepG2 cells (Figure 3B), when Pae was employed at 62.5 mg/L, the number of apoptotic cells was only slightly above that of the control. However, the apoptotic rate rose greatly when treated in combination with 2.5 mg/L CDDP (Figure 3B). Similar results were found in SMMC-7721 cells (Figure 4B).
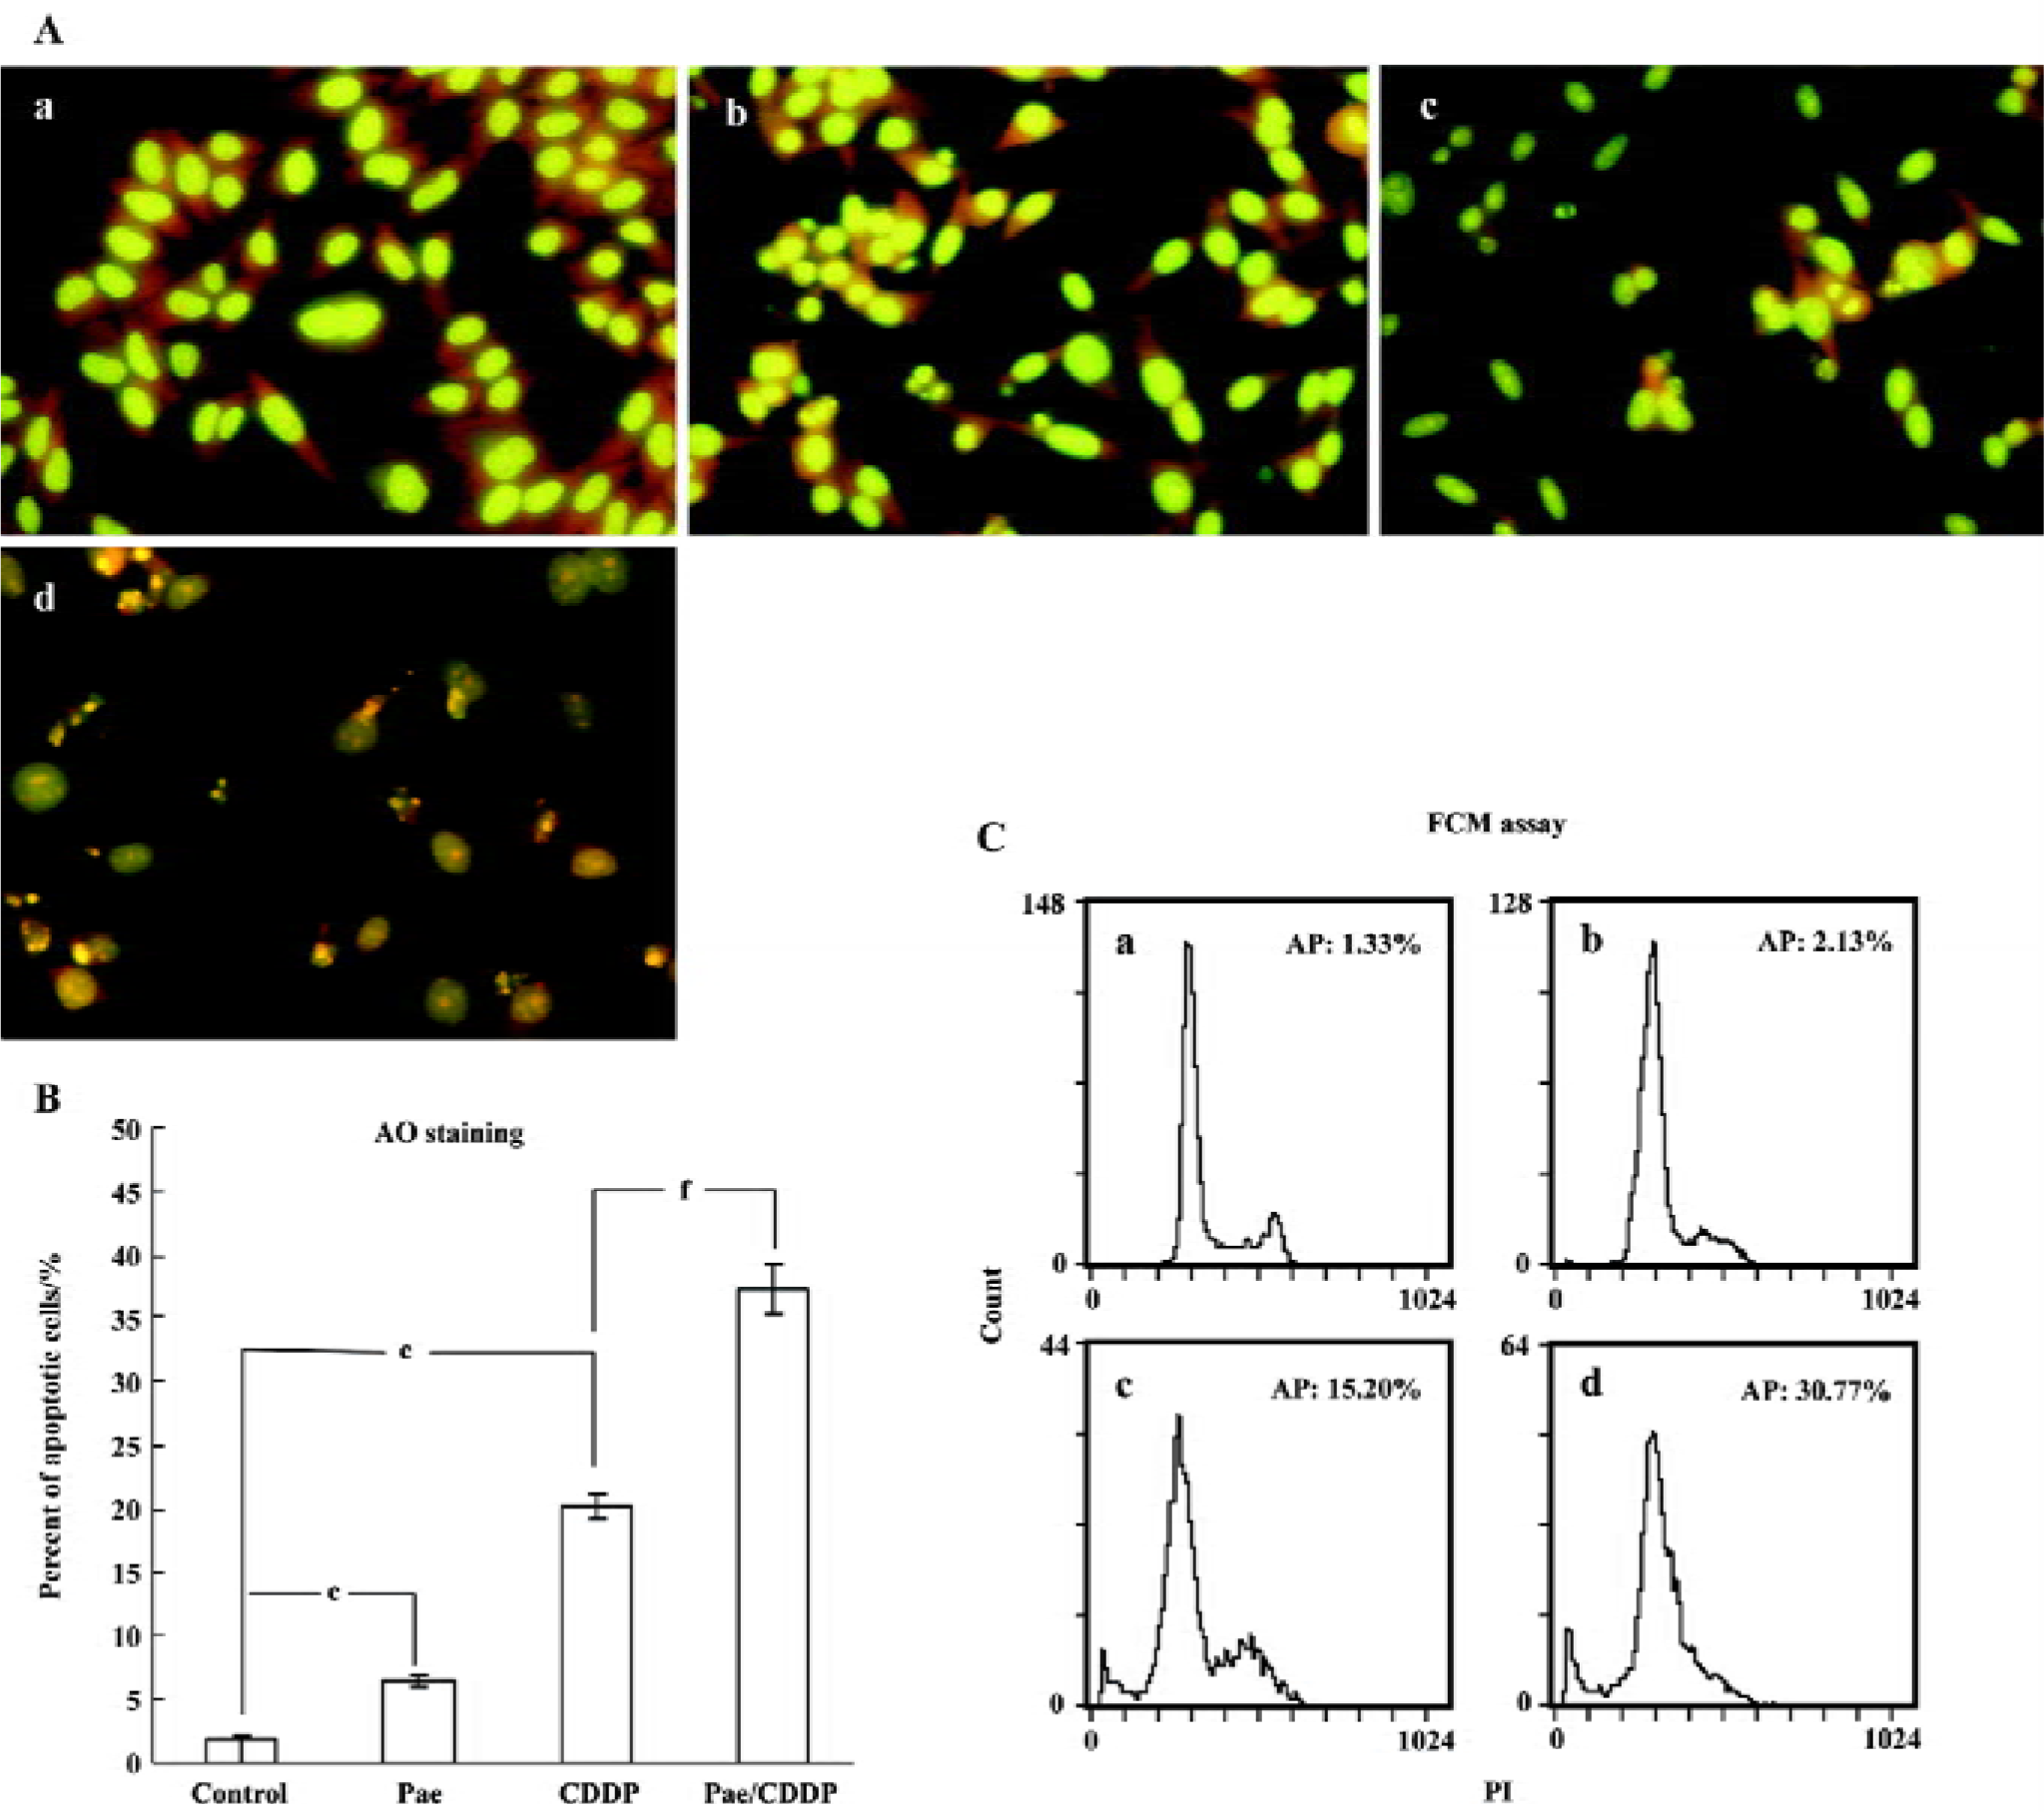
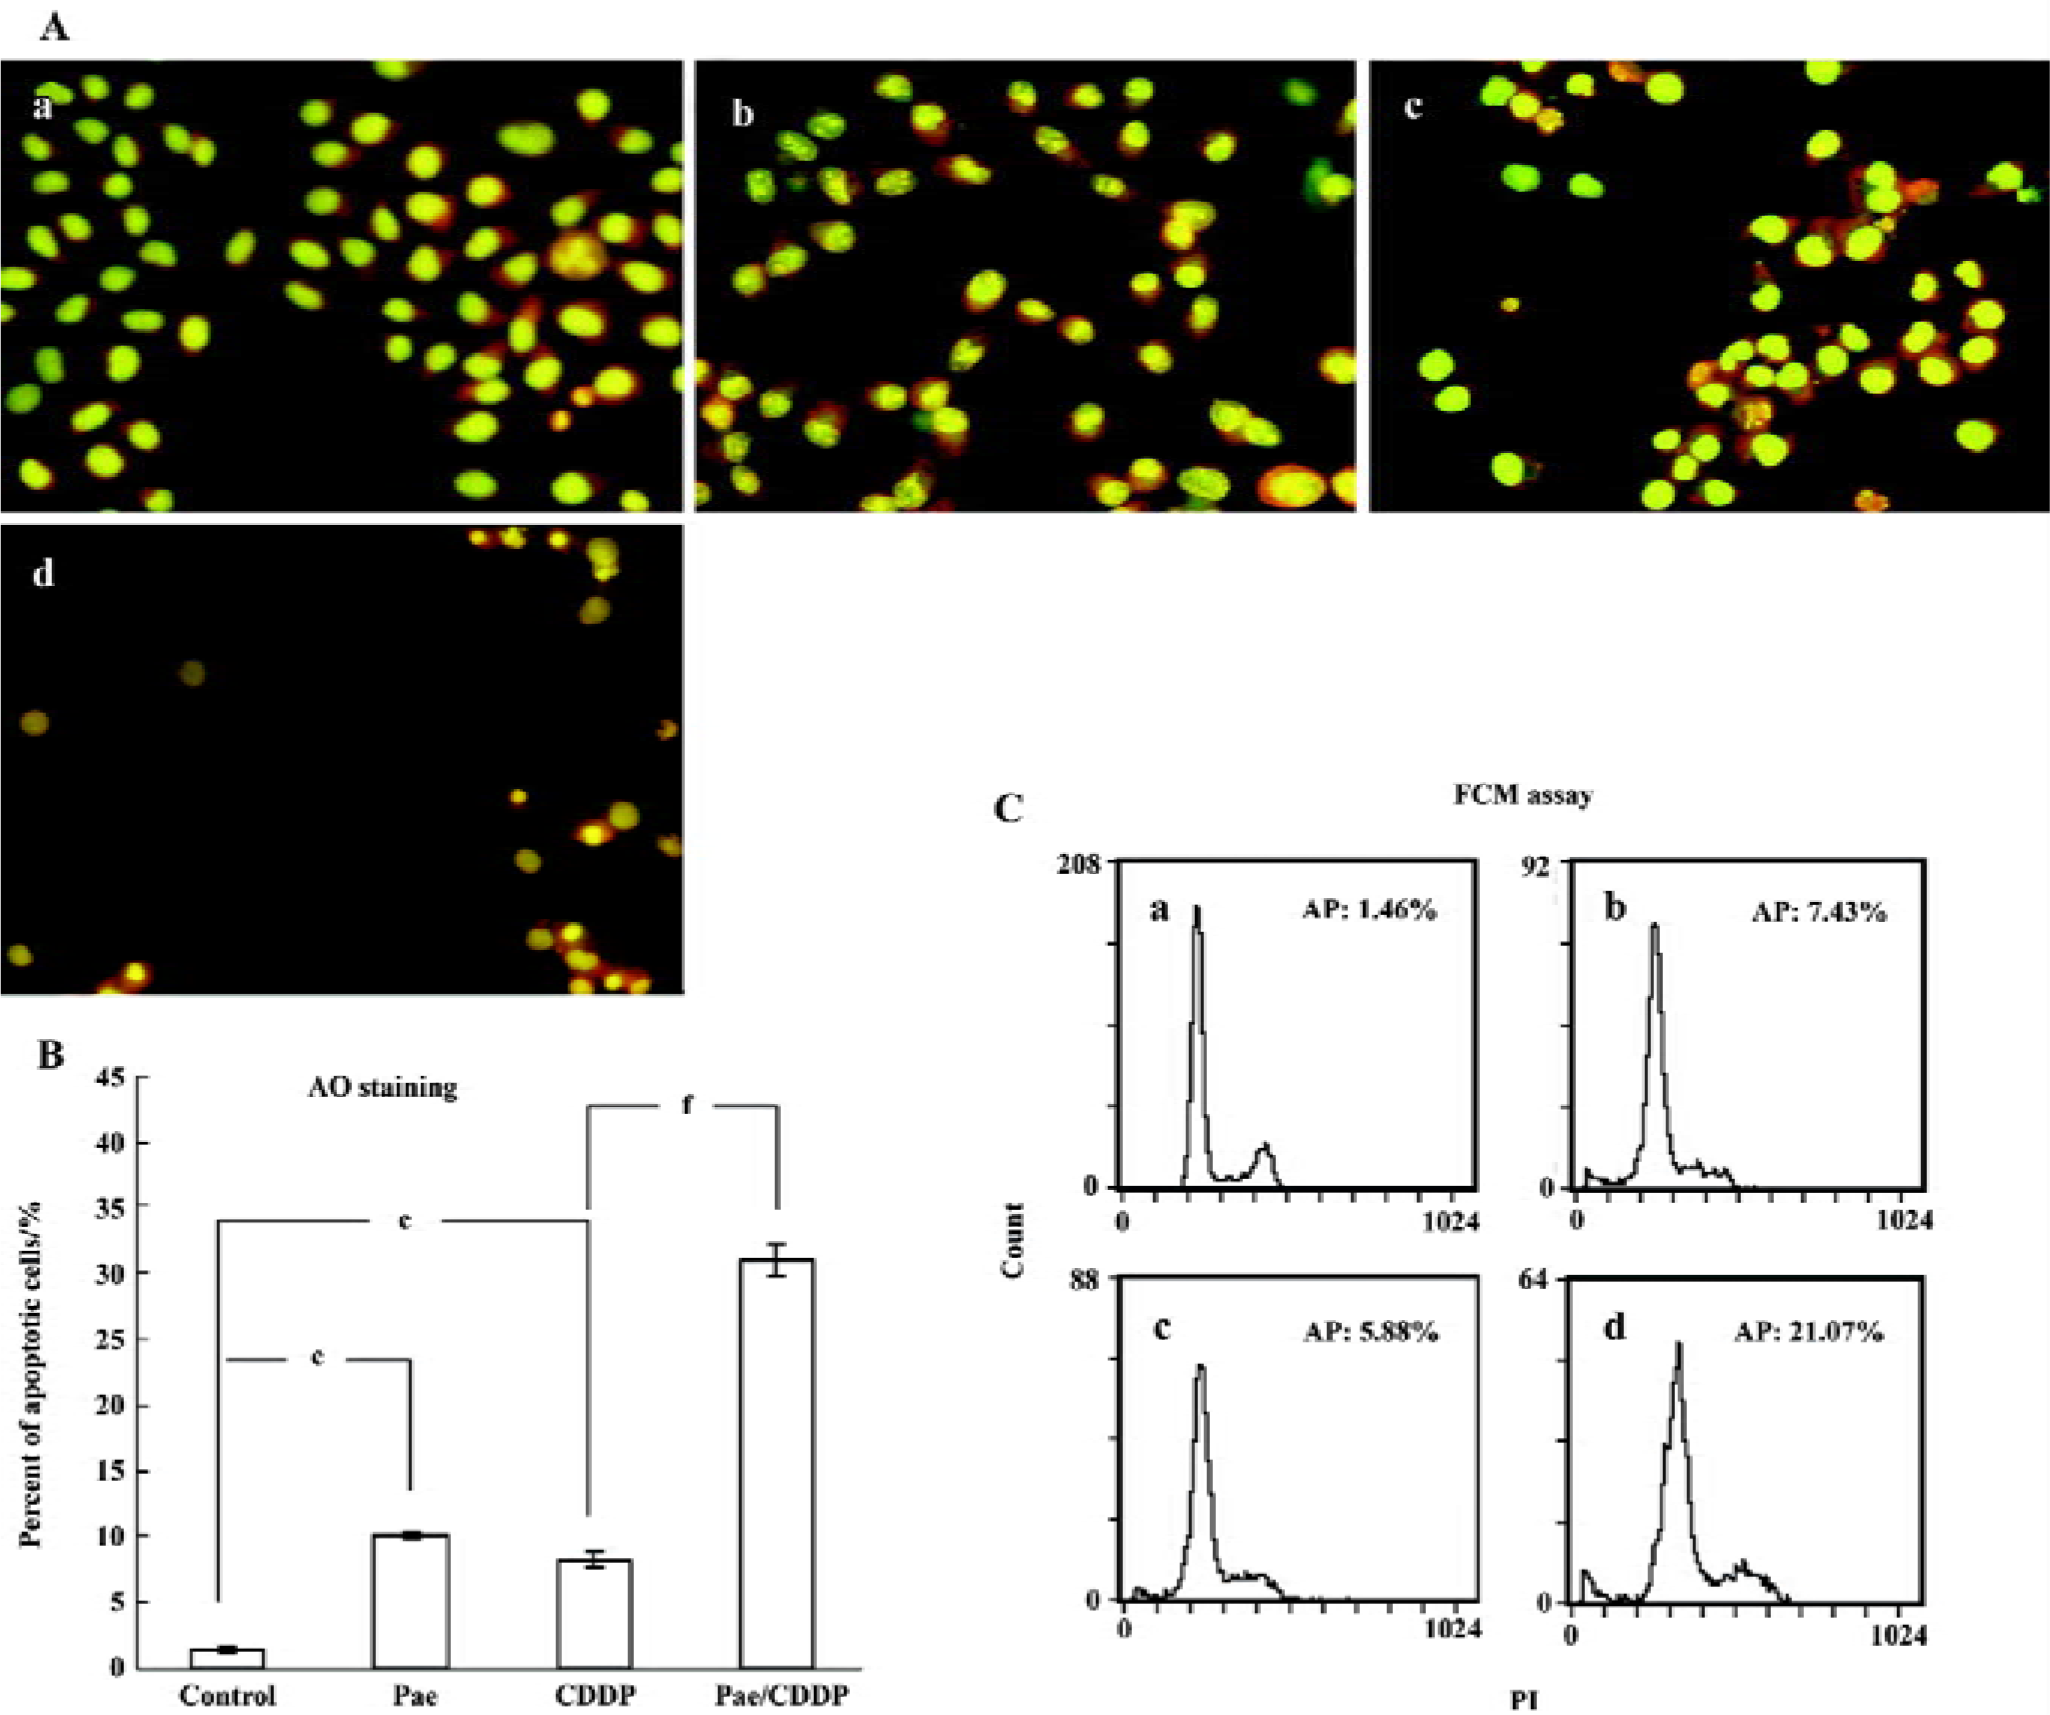
The induction of apoptosis by the treatment groups was also evident from the FCM(Flow cytometry) assay (Figures 3C, 4C). The sub-G1 peak, which appeared before the G1 phase that represents apoptotic cell population, was observed clearly in the 2 cell lines treated with CDDP alone. The apoptotic peak was dramatically increased when the cells were exposed to Pae combined with CDDP.
Cell cycle perturbation caused by Pae and CDDP Mcycle software was used to analyze the kinetic changes of cell cycle distribution. The HepG2 cells exposed to Pae (31.25 mg/L) or CDDP (1.25 mg/L) alone appeared to move out of the G0/G1 phase and into the S phase, where the S-phase fraction increased while the G0/G1 fraction decreased. When treated with the combination of the 2 agents, the G0/G1 fraction of HepG2 cells decreased from 71.79%±0.76% to 49.59%±0.89%, and the total S-phase fraction increased from 21.04%±0.58% to 47.07%±1.39% (Table 1). The phenomenon indicates that the combination of the 2 agents may arrest the cell cycle at the S phase, which may prevent cells from entering the M phase. The SMMC-7721 cells exposed to the combination group could also arrest cells in the S phase.
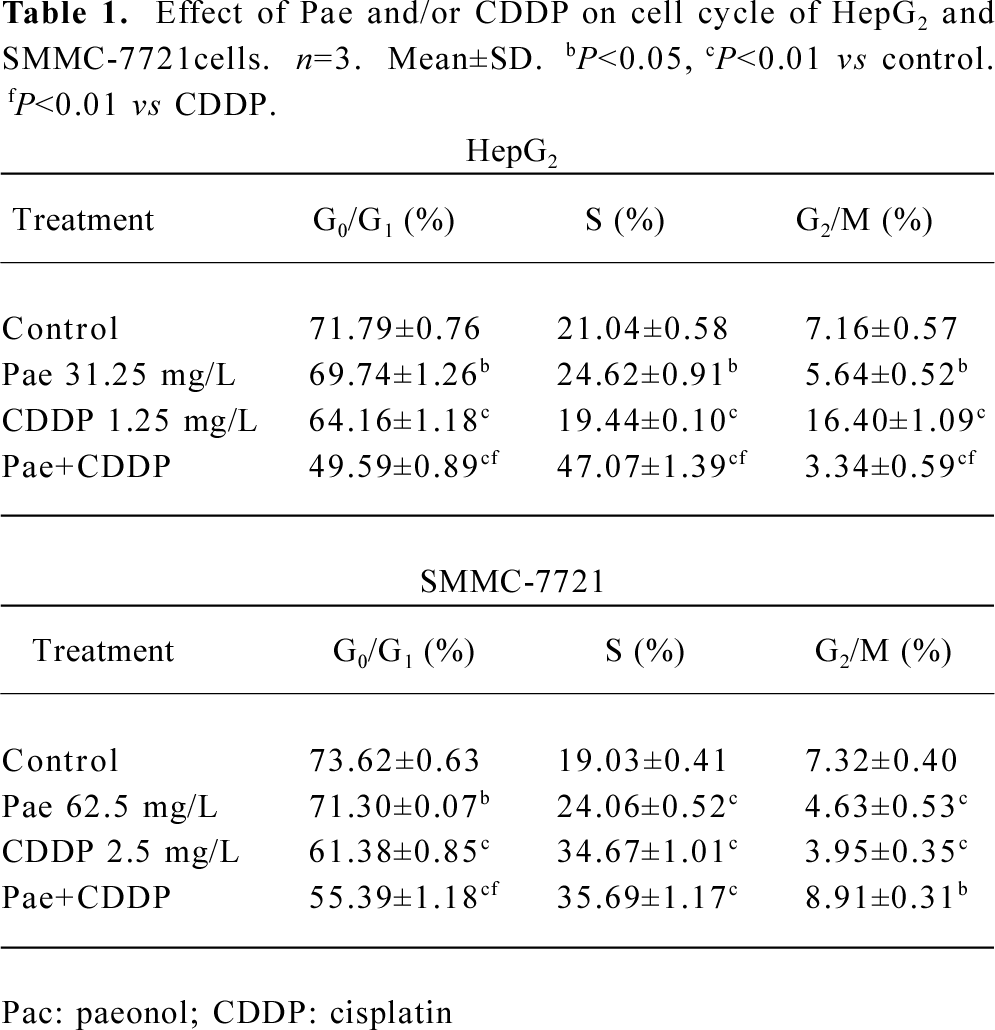
Full table
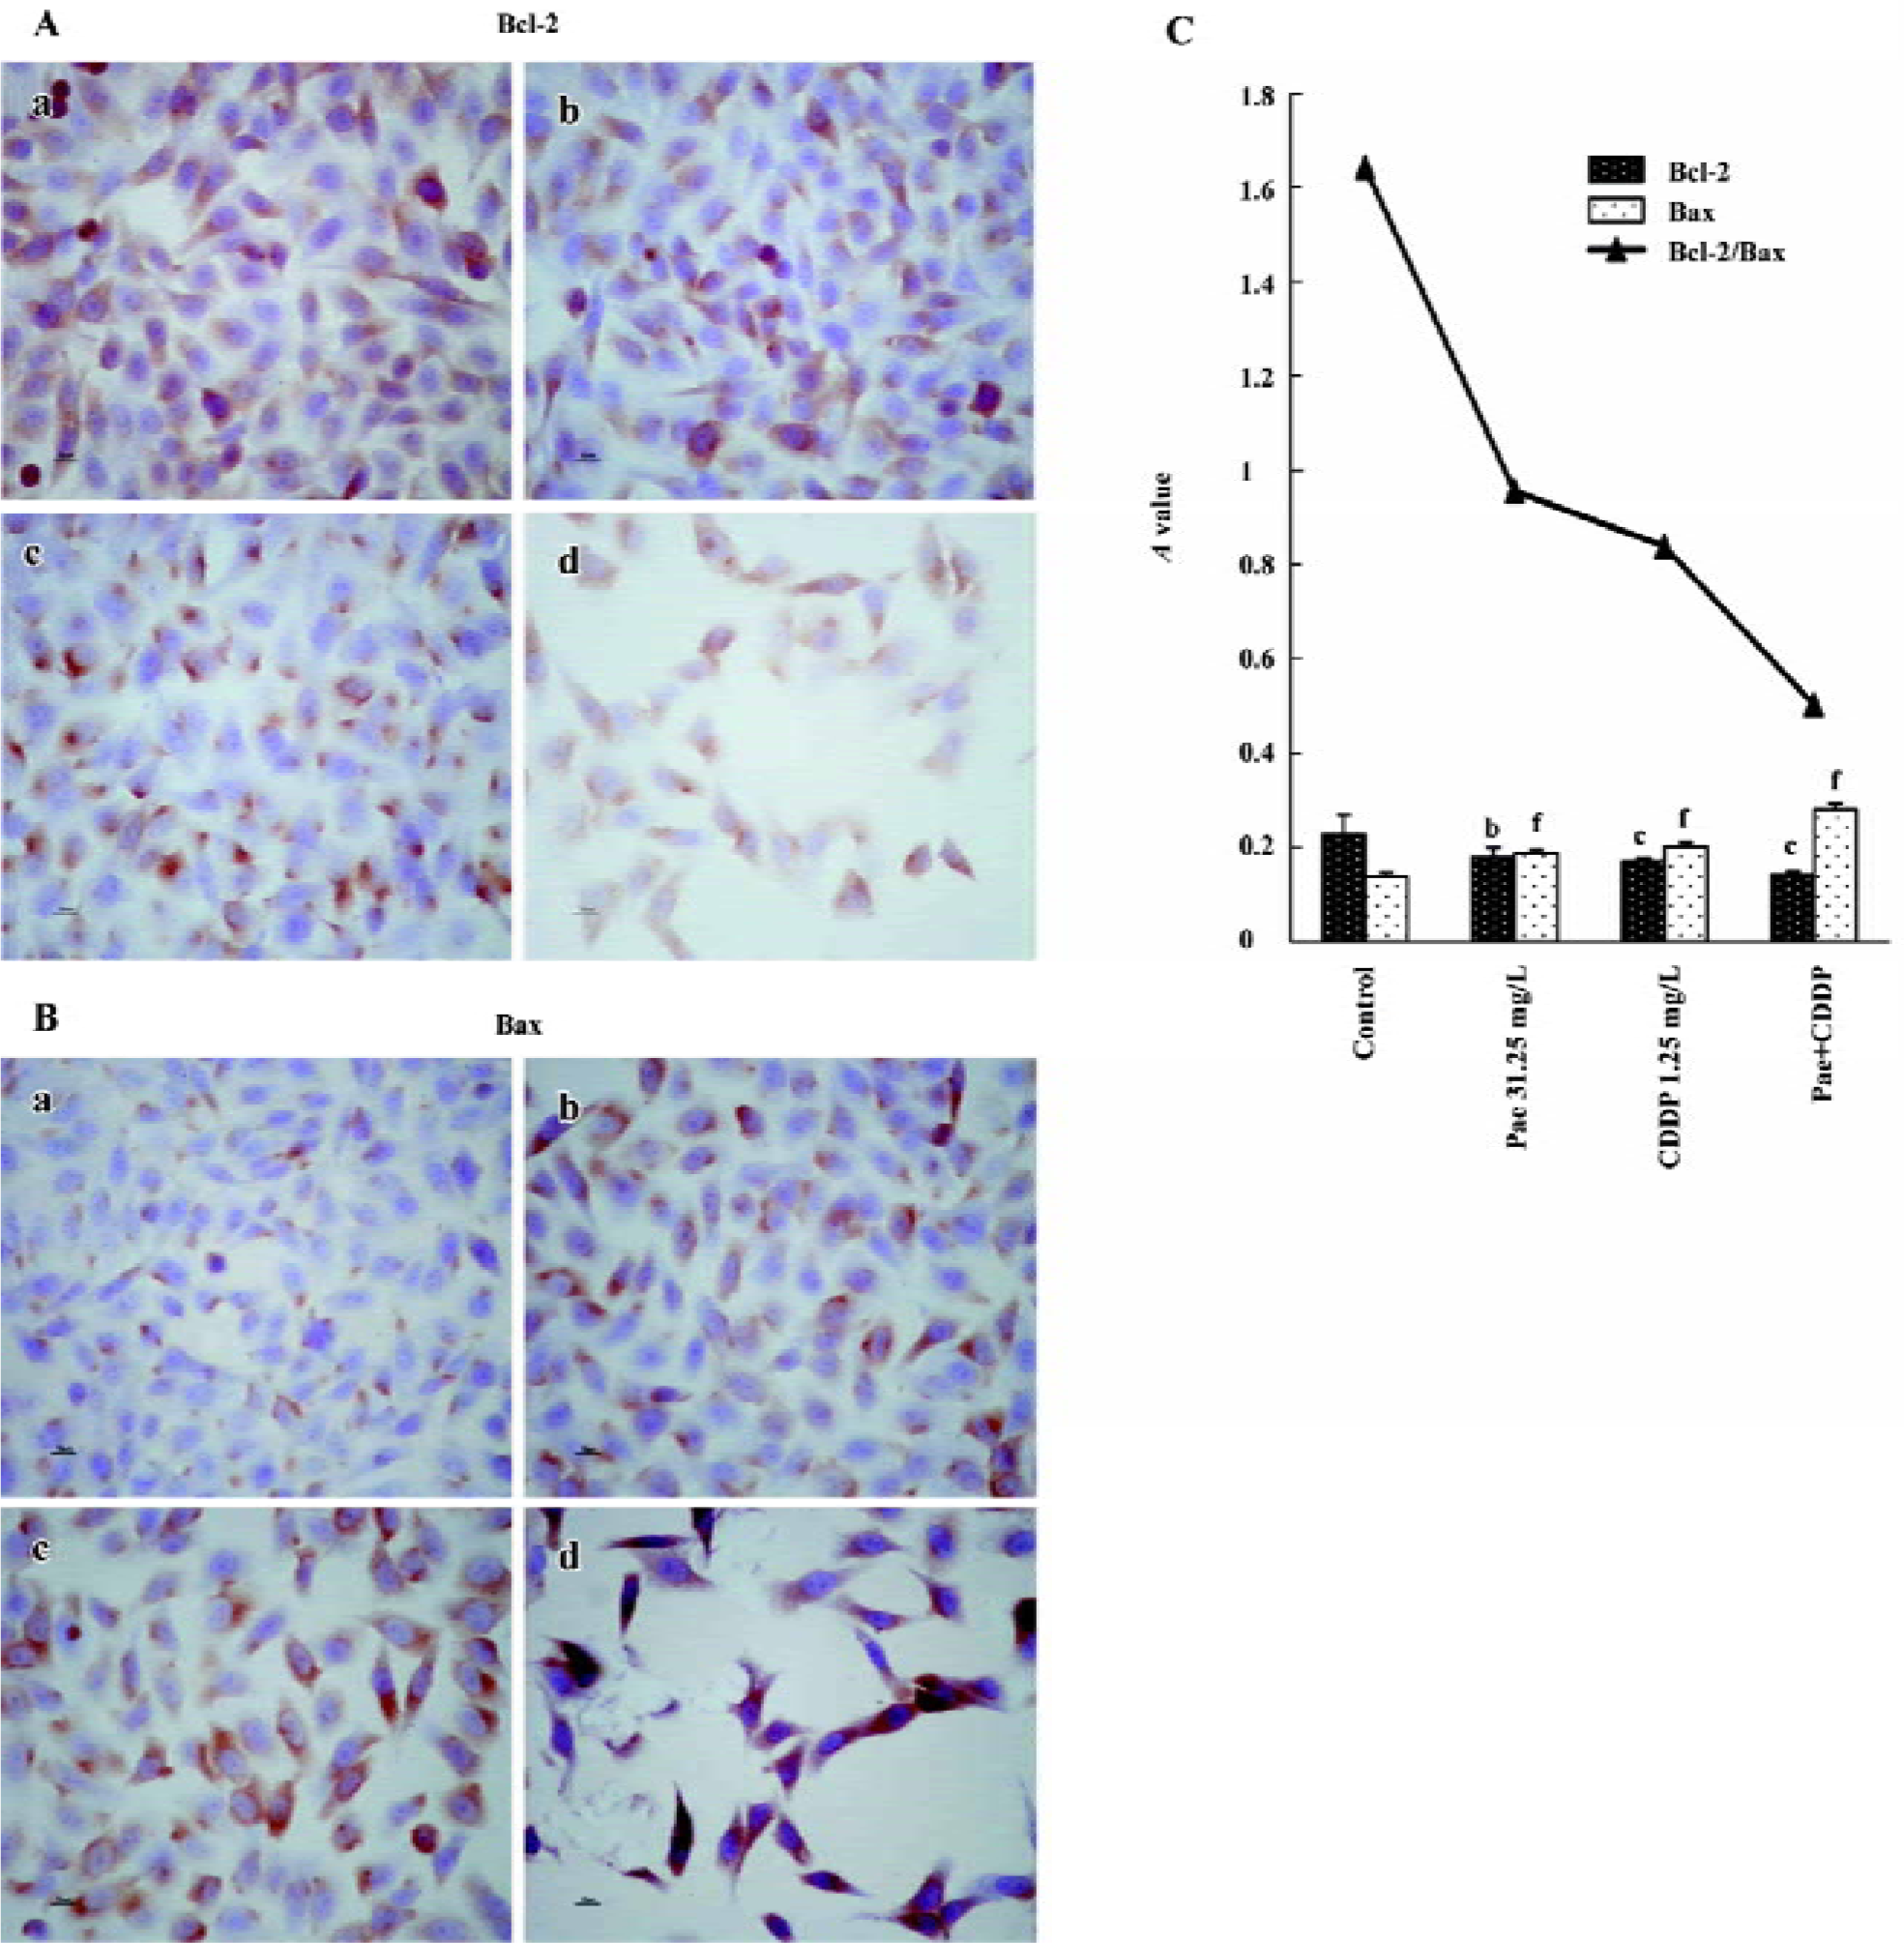
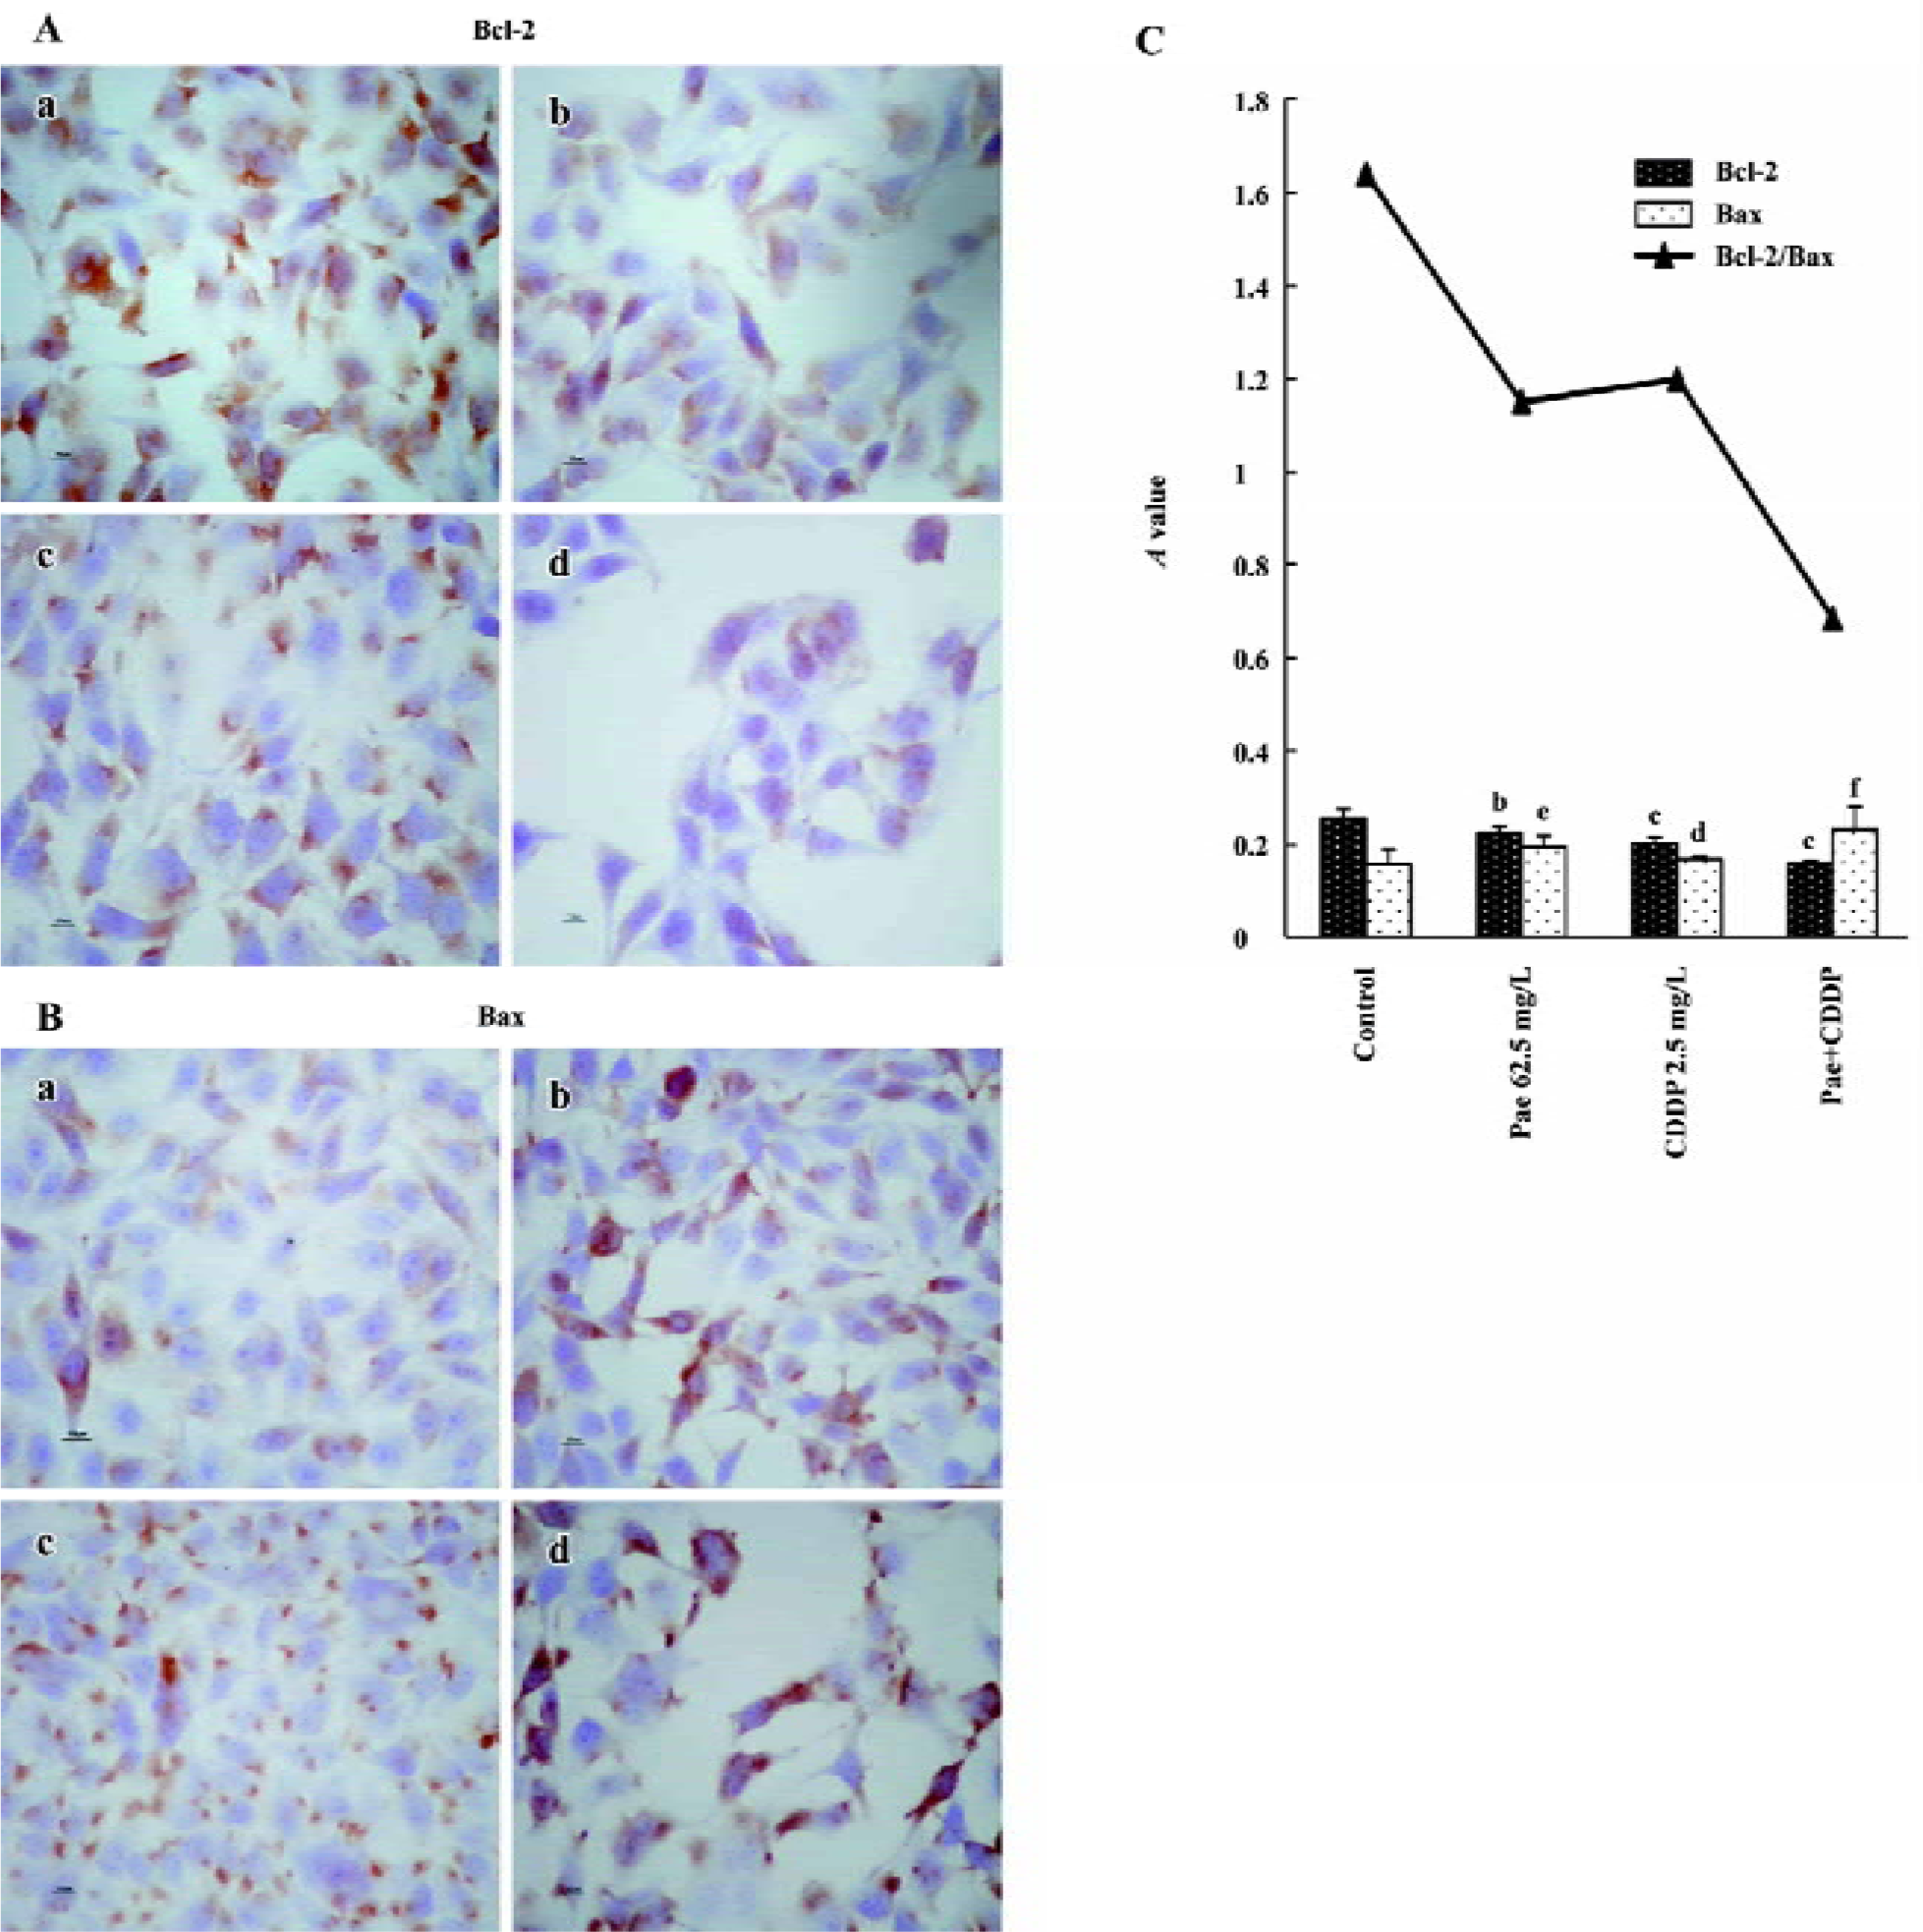
Effect of Pae and CDDP on the expression of Bcl-2 and Bax The S-P method was used to examine the expression of Bcl-2 and Bax. The standard positive Bcl-2 and Bax expressions were stained brown or yellow mainly in the cytoplasm or membrane. Bcl-2 and Bax were both expressed in the 2 cell lines. The expression of Bcl-2 decreased in the treatment groups, especially in the combination group (Figures 5A,6A). In contrast, there was a significant increase of Bax expression in the combination group compared to the control (Figures 5B, 6B). The results were quantitatively analyzed by the Biological Image Analysis System. The expression of Bcl-2 was downregulated and that of Bax was upregulated by Pae and/or CDDP. Correspondingly, the ratio of Bcl-2/Bax decreased, especially in the combination group (Figures 5C, 6C).
Discussion
The findings of the present study demonstrated that Pae and CDDP, used as a single agent, possessed growth inhibition to HepG2 and SMMC-7721 cells in a dose-dependent manner. There was a synergistic interaction between Pae and CDDP in the 2 cell lines. The cytotoxity of the combination group was significantly higher than that treated with Pae or CDDP alone in appropriate concentrations. We also found that the interaction between Pae and CDDP was specific to each cell line. In HepG2 cells, at lower concentrations of Pae and CDDP, the combination was synergistic. The synergistic effect was the most prominent (CDI <0.7) when 15.63 mg/L Pae was combined with 1.25 mg/L CDDP in the HepG2 cells. Treatment with a combination of chemotherapeutic agents resulted in an improved response as well as the ability to use less toxic concentrations of the drugs, which indicates that the combination of CDDP and Pae in certain concentrations could result in a synergistic effect. Our results are in accordance with the findings of Ji et al[11] who demonstrated that Pae in low concentrations had a synergetic effect with 5-FU, MMC, and CDDP in inhibiting the proliferation of the human colorectal cancer cell line HT-29. Similar results were observed in the SMMC-7721 cells, but with different sensitivity. As many reports have shown, different cell lines are different in their susceptibility to drugs[13–16]. In this study, the 2 cell lines are both adherent, epithelial-like cells, but from different origins. The HepG2 cell was established from the tumor tissue of a 15-year-old Argentine boy with hepatocellular carcinoma in 1975, which was reported to produce a variety of proteins such as alpha-fetoprotein, albumin, alpha2-macroglobulin, alpha1-antitrypsin, and transferrin. The SMMC-7721 cell was established from the tumor tissue of a 56-year-old Chinese man with HCC in 1980. The different origins and different biological activities may be one of the reasons for the different susceptibility to the drugs.
Although the exact mechanism of the cytotoxicity of Pae against tumor cells is not entirely clear, many potential mechanisms have been proposed for the growth inhibition by Pae on cultured cells and animal models. These mechanisms include the induction of apoptosis[17,18] and immuno-regulation, such as promoted lymphocyte proliferation, interleukin-2 production by splenocytes, and TNF-α production by PMϕ (peritoneal macrophages) from model mice[9,10]. Apoptosis is a mechanism by which cells undergo death to control cell proliferation or in response to DNA damage. The hypothesis that failure to undergo apoptosis contributes to the development of resistance to anticancer agents has been the subject of extensive research[19,20]. Therefore, agents that facilitate apoptosis should improve therapeutic efficacy. Previous studies have demonstrated that Pae could induce apoptosis in K562[17] and HT-29 cells[18]. To investigate the apoptosis-inducing effect of Pae as a single agent and combined with CDDP in hepatoma cells, the morphological changes and apoptotic rate were detected. The cells treated with the drugs showed the typical characteristics of apoptosis, which were more prominent in the combination group. Similarly, an apoptotic peak appeared before the G1 phase when treated with Pae or CDDP alone, and a significant synergistic effect on the induction of apoptosis was observed in the combination group.
We also found that the HepG2 and SMMC-7721 cells exposed to Pae alone for 24 h showed depletion of the G1 fraction and accumulation in the S phase. Accumulation in the S phase has also been reported by Liu et al[18], in which Pae could induce cell cycle perturbation and HT-29 cells attracted in the S phase increased, while cells of the G0/G1 and G2/M phases decreased. The cytotoxic effect of CDDP is generally considered to be non-cell-cycle specific[21]. CDDP can cause perturbations in cell cycle distribution[22] and it is most specific to G1-phase cells, but also has strong effect on cells in the S phase[23]. Our data also suggested that the combination group exhibited enhanced S-phase arrest, along with depletion of the G0/G1 fraction, which may be one of the mechanisms related to these interactions.
To examine the mechanism of apoptosis, we examined the expression of the Bcl-2 protein family, which is an important regulator of apoptosis[24]. The Bcl-2 family includes pro-apoptotic members such as Bax, Bak, Bad, Bcl-Xs, Bid, Bik, Bim, and Hrk, and anti-apoptotic members such Bcl-2, Bcl-XL, Bcl-W, Bfl-1, and Mcl-1[25]. These effects are more dependent on the balance between Bcl-2 and Bax than on the Bcl-2 quantity alone[26–28]. In the present study, treatment with Pae and/or CDDP decreased the expression of Bcl-2 and increased the expression of Bax, especially in the combination group. Furthermore, a significant decrease in the ratio of Bcl-2/Bax was observed when Pae was treated in combination with CDDP, which correlated with the incidence of apoptosis. One possible explanation for the synergistic interaction could be suggested. The upregula-tion or downregulation of the Bcl-2 protein family by Pae and/or CDDP might be the mechanism to introduce apoptosis.
In summary, the results obtained in the present study indicate that Pae in combination with CDDP has significantly synergistic growth-inhibitory and apoptosis-inducing effect on the human hepatoma cell lines HepG2 and SMMC-7721, which may be related with cell cycle arrest and the upre-gulation of the Bcl-2 family. Pae is expected to be effective and useful as a new agent in HCC treatment in the future.
Acknowledgement
We thank Dr Zhi-min ZHAI and Ms Qing LI (Central Laboratory of the Provincial Hospital of Anhui) for the FACS analysis.
References
- McGlynn KA, London WT. Epidemiology and natural history of hepatocellular carcinoma. Best Pract Res Clin Gastroenterol 2005;19:3-23.
- Teo EK, Fock KM. Hepatocellular carcinoma: an Asian perspective. Dig Dis 2001;19:263-8.
- Johnson PJ. Hepatocellular carcinoma: is current therapy really altering outcome? Gut 2002;51:459-62.
- Shu X, McCulloch M, Xiao H, Broffman M, Gao J. Chinese herbal medicine and chemotherapy in the treatment of hepatocellular carcinoma: a meta-analysis of randomized controlled trials. Integr Cancer Ther 2005;4:219-29.
- Riley CM, Ren TC. Simple method for the determination of paeonol in human and rabbit plasma by high performance liquid chromatography using solid-phase extraction and ultraviolet detection. J Chromatogr 1989;489:432-7.
- Sun YC, Shen YX, Sun GP. Advances in the studies of major pharmacological activity of paeonol. Chin Tradit Pat Med 2004;26:579-82. Chinese..
- Jiang SP, Chen YX. Advances and application in the studies of the Pycnostelma paniculatum (Bunge) K.S. and paeonol. China J Chin Mater Med 1994;19:311-4. Chinese..
- Sun GP, Wang H, Shen YX, Xu SY. Inhibitory effects of paeonol on the proliferation on four tumor cell lines. Anhui Med Pharm J 2004;8:85-7. Chinese..
- Sun GP, Shen YX, Zhang LL, Zhou AW, Wei W, Xu SY. Study on immunomodulation and antitumor activity of paeonol in HepA tumor mice. Chin Pharm Bull 2003;19:160-2. Chinese..
- Sun GP, Shen YX, Zhang LL, Wang H, Wei W, Xu SY. Anti-tumor effect of paeonol in vitro and in vivo. Acta Univ Med Anhui 2002;37:183-5. Chinese..
- Ji CY, Tan SY, Liu CQ. Inhibitory effect of paeonol on the proliferation of human colorectal cancer cell line HT-29 and its synergistic effect with chemotherapy agents. Chin J Clin Gastro-enterol 2005;17:122-4. Chinese..
- Cao SS, Zhen YS. Potentiation of antimetabolite antitumor activity in vivo by dipyridamole and amphotericin B. Cancer Chemother Pharmacol 1989;24:181-6.
- Horie N, Hirabayashi N, Takahashi Y, Miyauchi Y, Taguchi H, Takeishi K. Synergistic effect of green tea catechins on cell growth and apoptosis induction in gastric carcinoma cells. Biol Pharm Bull 2005;28:574-9.
- Qi YL, Liao F, Zhao CQ, Lin YD, Zuo MX. Cytotoxicity, apoptosis induction, and mitotic arrest by a novel podophyllotoxin glucoside, 4DPG, in tumor cells. Acta Pharmacol Sin 2005;26:1000-8.
- Tyagi AK, Agarwal C, Chan DC, Agarwal R. Synergistic anti-cancer effects of silibinin with conventional cytotoxic agents doxorubicin, cisplatin and carboplatin against human breast carcinoma MCF-7 and MDA-MB468 cells. Oncol Rep 2004;11:493-9.
- Yim D, Singh RP, Agarwal C, Lee S, Chi H, Agarwal R. A novel anticancer agent, decursin, induces G1 arrest and apoptosis in human prostate carcinoma cells. Cancer Res 2005;65:1035-44.
- Sun GP, Wang H, Shen YX, Zhai ZM, Wei W, Xu SY. Study on effects of paeonol in inhibiting growth of K562 and inducing its apoptosis. Chin Pharm Bull 2004;20:550-2. Chinese..
- Liu CQ, Tan SY, Ji CY, Luo HS, Yu JP. The effects of paeonol on inhibiting the proliferation of human colorectal cancer cell line HT-29 and its molecule mechanism. Chin Pharm Bull 2005;21:1251-4. Chinese..
- Gottesman MM. Mechanisms of cancer drug resistance. Annu Rev Med 2002;53:615-27.
- Kaufmann SH, Vaux DL. Alterations in the apoptotic machinery and their potential role in anticancer drug resistance. Oncogene 2003;22:7414-30.
- Schweitzer VG. Cisplatin-induced cytotoxicity: the effect of pigmentation and inhibitory agents. Laryngoscope 1993;103:1-52.
- Nguyen HN, Sevin BU, Averette HE, Perras J, Ramos R, Donato D, et al. Cell cycle perturbations of platinum derivatives on two ovarian cancer cell lines. Cancer Invest 1993;11:264-75.
- Potter AJ, Rabinovitch PS. The cell cycle phases of DNA damage and repair initiated by topoisomerase II-targeting chemotherapeutic drugs. Mutat Res 2005;572:27-44.
- Adams JM, Cory S. The Bcl-2 protein family: arbiters of cell survival. Science 1998;281:1322-6.
- Reed JC. Bcl-2 and the regulation of programmed cell death. J Cell Biol 1994;124:1-6.
- Reed JC. Bcl-2 family proteins: regulators of apoptosis and chemoresistance in hematologic malignancies. Semin Hematol 1997;34:9-19.
- Zhang CL, Wu LJ, Tashiro S, Onodera S, Ikejima T. Oridonin induces apoptosis of HeLa cells via altering expression of Bcl-2/Bax and activating caspase-3/ICAD pathway. Acta Pharmacol Sin 2004;25:691-8.
- Zhong L, Li CM, Hao XJ, Lou LG. Induction of leukemia cell apoptosis by cheliensisin A involves down-regulation of Bcl-2 expression. Acta Pharmacol Sin 2005;26:623-8.
