Serum sodium concentration is significantly associated with the angio-graphic characteristics of coronary atherosclerosis1
Introduction
The effect of high sodium intake on the risk of cardiovascular disease has been debated. Much of this effect is thought to be mediated through raised blood pressure, although experimental data indicate that other mechanisms might also be involved. High sodium intake is associated with mortality and risk of coronary heart disease, independent of other cardiovascular risk factors, including blood pressure[1]. The cardioprotective effects of dietary potassium have been hypothesized as the basis for low cardiovascular disease rates in populations consuming “primitive” diets and in vegetarians in industrialized cultures[2]. Although numerous epidemiologic and clinical studies have shown the significant association between the urinary sodium excretion and urinary potassium excretion with the morbidity and mortality of coronary heart disease[3], there is little information available about the association between the angiographic characteristics of coronary atherosclerosis estimated by conventional coronary angiography and the serum sodium level.
The Gensini score assigns a severity score for a stenosed vessel depending on the degree of luminal narrowing and the importance of its location[4]. So we took advantage of the large sample size epidemiologic study to evaluate the association between the angiographic characteristics of coronary atherosclerosis and the serum sodium level.
Materials and methods
Experimental patients The study population consisted of 896 consecutive patients (684 males and 212 females) who underwent coronary angiography for suspected or known coronary atherosclerosis at the First Affiliated Hospital of Nanjing Medical University (Nanjing, China) from 2004 to 2005. Patients with spastic angina pectoris (ie acetylcholine-positive) were excluded. Patients with infectious processes within 2 weeks before catheterization, heart failure (Killip class ≥2 after acute myocardial infarction), hepatic dysfunction, vascular disease (aortitis treated with prednisolone), familial hypercholesterolemia, thyroid dysfunction, or adrenal dysfunction were also excluded. This study was approved by the Ethics Committee of the First Affiliated Hospital of Nanjing Medical University, and informed consent was obtained from each patient.
Coronary angiography and echocardiography The coronary arteries were cannulated by the Judkins technique[5] with 5F catheters, and coronary angiography was performed from several projections. The severity of coronary atherosclerosis was defined by the Gensini score system, based on the hypothesis that the severity of coronary heart disease should be considered as a consequence of the functional significance of the vascular narrowing and the extent of the area perfused by the involved vessel or vessels. Therefore, the Gensini score was computed by assigning a severity score to each coronary stenosis according to the degree of luminal narrowing and its geographic importance. The reduction in the lumen diameter and the roentgenographic appearance of concentric lesions and eccentric plaques were evaluated (reductions of 25%, 50%, 75%, 90%, 99%, and complete occlusion were given Gensini scores of 1, 2, 4, 8, 16, and 32, respectively). Each principal vascular segment was assigned a multiplier in accordance with the functional significance of the myocardial area supplied by that segment: the left main coronary artery, ×5; the proximal segment of left anterior descending coronary artery (LAD), ×2.5; the proximal segment of the circumflex artery, ×2.5; the mid-segment of the LAD, ×1.5; the right coronary artery, the distal segment of the LAD, the posterolateral artery and the obtuse marginal artery, ×1; and others, ×0.5[4]. Left ventricular ejection fraction (LVEF) is an important parameter in the assessment of cardiac mortality and morbidity. It also provides important diagnostic, therapeutic, and prognostic information for patients with known or suspected coronary heart disease. Currently, left ventricular angiography is considered the gold standard for the measurement of LVEF. However, it is associated with risks, and its invasive nature does not allow for it to be repeated on a frequent basis. Therefore, non-invasive techniques for the assessment of LVEF are commonly used in clinical practice. To evaluate the heart function of the patients, LVEF was assessed by 2-D echocardiography.
Cigarette smoking and alcohol intake Cigarette smoking and alcohol intake were assessed by means of a standardized questionnaire. The patients’ smoking status was classified as never smoking and smoking (including formerly smoked and currently smoking). Patients who reported consuming alcohol at least 50 g/week were regarded as current drinkers. Alcohol intake status was classified as never drinking and drinking (including formerly drank and currently drinking).
Laboratory measurements The 12-h fasting blood samples were drawn in the morning. Thereafter, the blood samples were centrifuged, and serums were separated, collected, and analyzed. All laboratory measurements were conducted at the Central Clinical Laboratory in the First Affiliated Hospital of Nanjing Medical University. The concentrations of potassium, sodium, and chlorine were measured with an ion selective electrode analyzer (Medica EasyLyte PLUS, Bedford, MA, USA). The level of total chole-sterol, triglyceride, fasting blood glucose, urea, creatinine, and uric acid were determined by enzymatic procedures on an automated auto analyzer (AU 2700 Olympus, 1st Chemical, Tokyo, Japan). The laboratory was monitored for precision and accuracy of glucose and lipid measurements by the agency’s surveillance program. Measurements on agency-assigned quality control samples showed no consistent bias over time within or between surveys.
Statistical methods Data analysis was performed using the Statistical Package for Social Science (SPSS for Windows, version 10.0, SPSS, Chicago, IL, USA). Patients were classified into 4 groups with sodium level using the quartile values as cut-off points so that each group had about an equal number of patients to minimize any bias that may have been produced in the statistical analysis. Data of body mass index (BMI) and uric acid were normally distributed parameters and presented as mean±SD; comparisons were analyzed by one-way ANOVA. Skewed data, including age, blood pressure, potassium, chlorine, total cholesterol, triglyceride, fasting blood glucose, urea, creatinine, LVEF, and the Gensini score were expressed as the median and quartile range; comparisons were analyzed by the Kruskal-Wallis test. Categorical variables, including sex, smoking, and drinking were compared among the groups of patients by χ2-test. The Spearman two-way test and partial correlation were used to assess the relation between 2 quantitative variables. We assessed the independent correlation of the sodium level with the multiple linear regression analysis. We used the multinomial logistic regression analysis to study the relation between quartiles of sodium level and the Gensini score. Differences were considered significant at P<0.05, and all P-values were 2-tailed.
Results
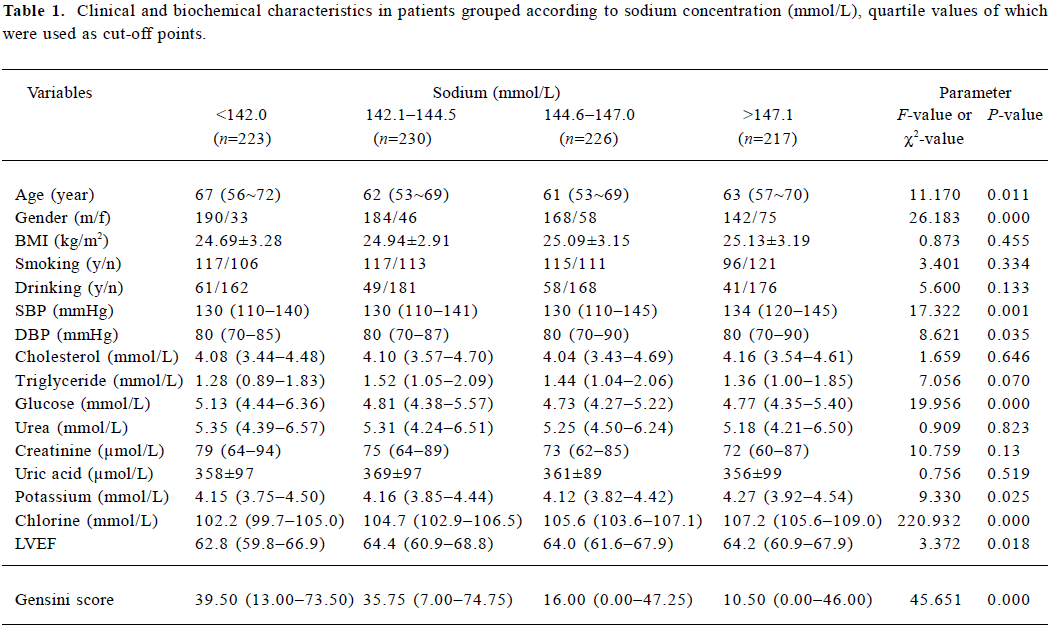
Clinical and biochemical characteristics in patients grouped according to sodium level Table 1 shows the clinical and biochemical characteristics in patients grouped according to sodium concentration, quartile values of which were used as cut-off points. The frequency distribution of smoking status (P=0.334) and drinking status (P=0.133) was similar among the 4 groups; however, the frequency distribution of gender (P=0.000) differed among the groups. The level distribution of BMI (P=0.455), total cholesterol (P=0.646), triglyceride (P=0.070), urea (P=0.823), creatinine (P=0.130), and uric acid (P=0.519) were similar among the 4 groups, whereas those of age (P=0.011), systolic blood pressure (SBP; P=0.001), diastolic blood pressure (DBP, P=0.035), fasting blood glucose (P=0.000), potassium (P=0.025), chlorine (P=0.000), LVEF, and the Gensini score (P=0.000) differed significantly among the groups.

Full table
Hyponatremia and hypernatremia of the patients To assess gender and age as risk factors for hyponatremia and hypernatremia and describe the prevalence of hyponatremia and hypernatremia in this study population, the binary logistic regression analysis was performed. In this regression analysis, hyponatremia was defined as the serum sodium concentration less than 136 mmol/L and was coded as 1 (or otherwise coded as 0), and hypernatremia was defined as the serum sodium concentration greater than 145 mmol/L and was coded as 1 (or otherwise coded as 0). Age (classified in 4 groups with age levels using quartile values as cut-off points) and gender (male was set 1, female was set 2) were set as the independent variables, and hyponatremia and hypernatremia were employed as the dependent variables, respectively. The results are summarized in Table 2. The results indicated that females were at greater risk of hyperna-tremia, and increasing age was a risk factor for hyponatremia.

Full table
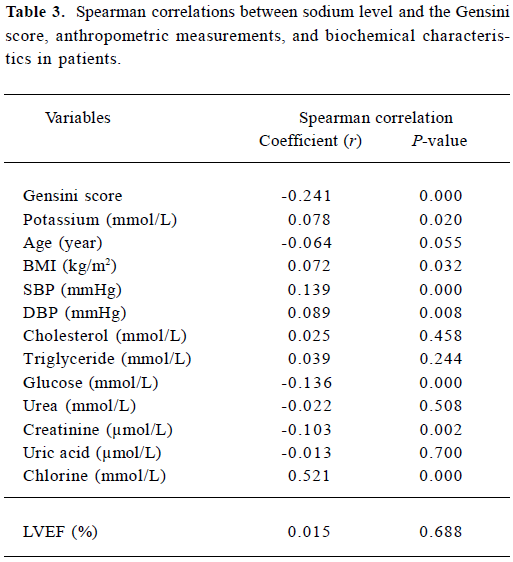
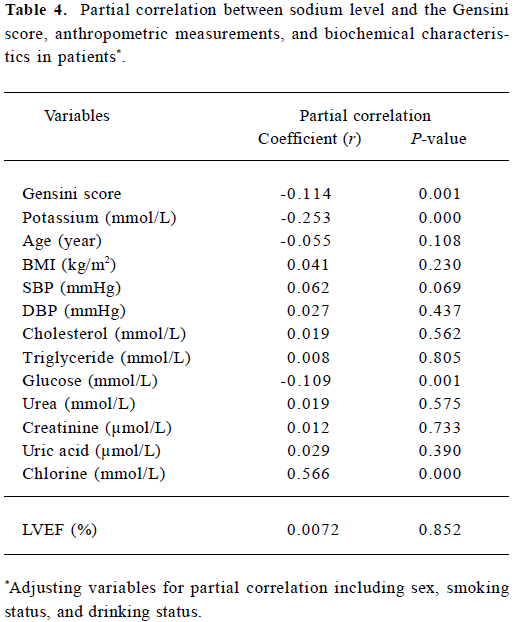
Spearman correlations and partial correlations between sodium and the Gensini score, anthropometric measure-ments, and biochemical characteristics in patients Tables 3 and 4 show the results of the Spearman correlations and partial correlations (controlling for gender, smoking status, and drinking status) between sodium and the Gensini score, anthropometric measurements, and biochemical characteristics in the patients. The results in Tables 3 and 4 indicated that the concentration of sodium significantly correlated with the Gensini score, potassium level, chlorine, and glucose, whereas the sodium level had no significant correlation with age, BMI, SBP, DBP, total cholesterol, triglyceride, urea, creatinine, LVEF, and uric acid, respectively.

Full table

Full table
Multiple linear regression analysis with the Gensini score as the dependent variable To examine the independent associations between the Gensini score and the concentration of sodium, the multiple linear stepwise regression analysis was performed. In this model, the Gensini score was employed as the dependent variable. The independent variables included age, BMI, SBP, DBP, total cholesterol, triglyceride, fasting blood glucose, urea, creatinine, uric acid, sodium level, potassium level, chlorine, and LVEF. In the final model (Table 5), LVEF (β=-0.228, P=0.010), age (β=0.137, P=0.010), glucose level (β=0.129, P=0.000), and sodium level (β=?0.106, P=0.004) were significantly and independently associated with the Gensini score.

Full table
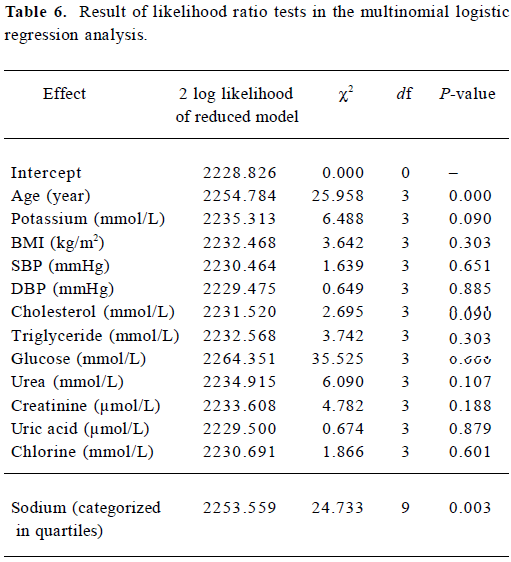
Multinomial logistic regression analysis to study the relation between quartiles of sodium level and the Gensini score To evaluate the association between quartiles of sodium level and the Gensini score, the multinomial logistic regression analysis was conducted. In the analysis, the Gensini score (categorized in quartiles) was employed as a dependent variable; the sodium level (categorized in quartiles) was set as a factor. The covariate variables included age, BMI, SBP, DBP, total cholesterol, triglyceride, fasting blood glucose, urea, creatinine, uric acid, potassium level, and chlorine level. The result of the likelihood ratio tests in the multinomial logistic regression analysis (Table 6) indicated that age, fasting blood glucose level, and sodium level (categorized in quartiles) was significantly associated with the Gensini score (categorized in quartiles), respectively. In addition, the parameter estimates of the multinomial logistic regression analysis (data not shown) showed that in the first quartile of the Gensini score (the group with the lowest level), the odds ratio [95% confidence interval (CI)] of sodium level (categorized in quartiles) was 0.387 (0.197−0.761; P=0.006) in the first quartile, 0.413 (0.231−0.738; P=0.003) in the second quartile, and 0.995 (0.560−1.768; P=0.986) in the third quartile. From these results, it can be concluded that hyponatremia was the risk factor for the higher Gensini score.

Full table
Discussion
The present study documents that the severity of angio-graphic characteristics of coronary atherosclerosis estimated by the Gensini score was significantly and negatively associated with the serum sodium level, independent of the other cardiovascular risk factors including age, gender, BMI, SBP, DBP, total cholesterol, triglyceride, fasting blood glucose, urea, creatinine, and uric acid. To the best of our knowledge, this is the first study focused on the relationship between the severity of angiographic characteristics of coronary atherosclerosis and the serum sodium level; the actual mechanism underlying the above relationship needs further study.
Under normal conditions, serum sodium concentrations are finely maintained within the narrow range of 135?145 mmol/L despite great variation in water and salt intake. Sodium and its accompanying anions, principally chloride and bicarbonate, account for 86% of the extracellular fluid osmolality, which is normally 285?295 mosm/kg. Disorders of serum sodium are the most common electrolyte disturbances in clinical medicine, yet they remain poorly under-stood. There is little agreement on the prevalence of the disturbances of sodium balance or on the importance of gender and age as markers of risk[6]. Data from 303 577 samples on 120 137 patients were available for analysis, and the results suggest that increasing age is a risk factor for hyponatremia[7]. In the same study, gender was not set as an important risk factor for disturbances of serum Na concentration[7]. However, the results from the current study indicated that females were at greater risk of hypernatremia. The findings of this study should remind medical staff of the risk factors for hyponatremia and hypernatremia, and that increasing age is a risk factor for hyponatremia.
In recent years, a role for an inadequate electrolyte balance in determining an increased risk of metabolic syndrome and associated vascular complications has been claimed[8]. The current study is an interesting finding that on the surface seems to go against conventional wisdom that excess sodium is cardiotoxic. A recently reported prospective study followed 1173 Finnish men and 1263 women aged 25?64 years with complete data on 24 h urinary sodium excretion and cardiovascular risk factors. The hazards ratios for coronary heart disease, cardiovascular disease, and all-cause mortality associated with a 100 mmol increase in 24 h urinary sodium excretion were 1.51 (95% CI 1.14?2.00), 1.45 (1.14?1.84), and 1.26 (1.06?1.50), respectively, in both men and women. These results provide direct evidence that high sodium intake is associated with mortality and risk of coronary heart disease, independent of other cardiovascular risk factors, including blood pressure[1]. Unfortunately, the available data about the relationship between serum sodium concentration and coronary atherosclerosis/coronary artery disease are minimal. However, there are a few prospective studies of the relation of sodium intake to cardiovascular morbidity, and mortality may support the hypotheses in this manuscript. In roughly 3000 of the employed and systematically-treated (mild and moderately-treated), well-controlled hypertensive patients, urine was collected over a 24 h period before the initiation of therapy and was used to relate to events over an average of 4 years. There was a significant inverse association of sodium intake to mortality, so an increase in sodium intake of 66 mmol/24 h was associated with a 36% reduction in coronary events[9]. This result was independent of plasma renin activity. These data are consistent with the finding in the same population of the significant association of increased plasma renin activity with increased coronary events [10]. There is a report of the general population which links baseline sodium intake as assessed by 24 h dietary recall to 22 year mortality in the National Health and Nutrition Examination Survey Epidemiological Follow-Up[11]. In 11 348 patients from this representative national sample, there were nearly 4000 deaths, almost half of which were cardiovascular related. Here, too, an inverse, albeit modest, relation of salt intake to cardiovascular mortality was observed. When the analysis was restricted to patients without prevalent cardiovascular disease at entry, the results were similar. Thus, the results from the above study are consistent with those of our study where the serum sodium level has an inverse association with the severity of coronary atherosclerosis.
The mechanism which may account for the relationship between the severity of angiographic characteristics of coronary atherosclerosis and the serum sodium level was unknown. However, rennin angiotensin system (RAS) activation may play a key role. The sodium depletion observed in the patients with greater coronary disease may be a cause or a consequence of RAS activation. The components of the RAS have been identified in the cardiac tissues of humans and various animal species, and the existence of a functional cardiac RAS continuously forming low levels of angiotensin (Ang) II has been demonstrated in humans. The vascular formation of AngII has also been demonstrated in the experimental preparation of isolated vascular tissues and in humans. Locally-formed AngII may directly or indirectly affect the pathophysiology of atherosclerosis[12]. The activation of the RAS may exert numerous adverse effects on the cardiovascular system[13] (ie arterial hypertension, chronic renal failure, and potentially, atherosclerosis). An additional hemodynamic effect is mediated by the RAS. Under usual circumstances, the RAS modulates volume and vasoconstriction to maintain pressure. As part of this physiologic process, there is an inverse relation of sodium intake and RAS activity. Thus, a 100 mmol/24 h reduction in sodium intake generates a 3-fold increase in plasma renin activity, a measure of RAS activity [14]. Although this mechanism is appropriate to sustain BP, an elevated RAS also has adverse effects on the vascular endothelium and smooth muscle cells and stimulates inflammatory agents. The net result is atherogenic[15]. In fact, among hypertensive patients, all other things being equal, an increased renin is associated with increased myocardial infarction. Other untoward cardiovascular effects of sodium restriction, linked to the RAS include the generation of aldosterone and the sustained stimulation of the sympathetic nervous system. The latter is perhaps responsible for the increased insulin resistance that is known to accompany low-sodium diets[16].
In a clinical study experimentally evaluating the hyponatremic response to acute hyperglycemia, it was demonstrated that every 5.6 mmol/L increase in glucose was accompanied with about a 1.6 mmol/L decrease in sodium concentration[7]. The results from the above study are consistent with those of our study; the inverse association of the sodium level with the glucose concentration is shown in Table 1. As the glucose concentration is increased in coronary artery disease patients, and the correlation between glucose and coronary artery disease severity is significant, this result may be another reason which accounts for the inverse relationship between the severity of angiographic characteristics of coronary atherosclerosis and the sodium level.
The limitation of the present study is that it is only a cross-sectional study rather than a prospective study, and it can not provide information regarding the cause and effect relationship between the serum sodium concentration and coronary atherosclerosis. The patients? urinary sodium level was not obtained, and the long-term prognosis value of serum sodium concentration for coronary heart disease needs further study.
In conclusion, the severity of angiographic characteristics of coronary atherosclerosis estimated by the Gensini score was significantly and negatively associated with the serum sodium level; the actually mechanism underlying the association needs further study.
References
- Tuomilehto J, Jousilahti P, Rastenyte D, Moltchanov V, Tanskanen A, Pietinen P, et al. Urinary sodium excretion and cardiovascular mortality in Finland: a prospective study. Lancet 2001;357:848-51.
- Young DB, Lin H, McCabe RD. Potassium's cardiovascular protective mechanisms. Am J Physiol 1995;268:R825-37.
- Srinath Reddy K, Katan MB. Diet, nutrition and the prevention of hypertension and cardiovascular diseases. Public Health Nutr 2004;7:167-86.
- Gensini GG. A more meaningful scoring system for determinating the severity of coronary heart disease. Am J Cardiol 1983;51:606.
- Judkins MP. A percutaneous transfemoral technique. Radiology 1967;89:815-21.
- Hawkins RC. Age and gender as risk factors for hyponatremia and hypernatremia. Clin Chim Acta 2003;337:169-72.
- Hillier TA, Abbott RD, Barrett EJ. Hyponatremia: evaluating the correction factor for hyperglycemia. Am J Med 1999;106:399-403.
- Resnick L. The cellular ionic basis of hypertension and allied clinical conditions. Prog Cardiovasc Dis 1999;42:1-22.
- Alderman MH, Madhavan S, Cohen H, Sealey JE, Laragh JH. Low urinary sodium is associated with greater risk of myocardial infarction among treated hypertensive men. Hypertension 1995;25:1144-52.
- Alderman MH, Madhavan S, Ooi WL, Cohen H, Sealey J, Laragh JH. Association of the rennin-sodium profile with the risk of myocardial infarction in patients with hypertension. N Engl J Med 1991;324:1098-104.
- Alderman MH, Cohen H, Madhavan S. Dietary sodium intake and mortality: The National Health and Nutrition Examination Survey (NHANES I). Lancet 1998;351:781-5.
- Serneri GGN, Boddi M, Poggesi M, Simonetti I, Coppo M, Papa ML, et al. Activation of cardiac renin-angiotensin system in unstable angina. J Am Coll Cardiol 2001;38:49-55.
- Grote K, Drexler H, Schieffer B. Renin-angiotensin system and atherosclerosis. Nephrol Dial Transplant 2004;19:770-3.
- Graudal NA, Gallie AM, Gared P. Effects of sodium restriction on blood pressure, rennin, aldosterone, catecholamines, choles-terols, and triglyceride — a meta analysis. JAMA 1998;279:1383-91.
- Dzau VJ. Tissue angiotensin and pathobiology of vascular disease — a unifying hypothesis. Hypertension 2001;37:1047-52.
- Gomi T, Shibuya Y, Sakurai J, Hirawa N, Hasegawa K, Ikeda T. Strict dietary sodium reduction worsens insulin sensitivity by increasing sympathetic nervous activity in patients with primary hypertension. Am J Hypertens 1998;11:1048-55.
