
Morphine enhances purine nucleotide catabolism in vivo and in vitro
Introduction
Opiates, such as morphine and heroin, exhibit a variety of physiological activities and have been utilized extensively in medicine, most prominently in the treatment of pain. However, at analgesic doses, opioid receptor agonists or partial agonists can induce unwanted side effects such as ventilatory depression[1,2], constipation, and the development of physical tolerance and dependence[3,4]. It is very important to investigate the biochemical mechanism and the basis of tolerance and dependence of morphine and heroin.
There were several reports on the relationship between opiate administration and changes in nucleotide metabolism. We have demonstrated that heroin could enhance the catabolism of purine nucleotides in vivo[5]. Heroin is a semisynthetic morphine ester, with 2 acetyl groups coupled to the 3- and 6-hydroxyl groups of morphine. After absorption, heroin is rapidly hydrolyzed to 6-monoacetylmorphine and morphine by serum and liver esterases. Our previous experiments in rat C6 glioma cells[6] found that the expression of these key enzymes, hypoxanthine guanine phosphoribosyl transferase (HGPRT) and adenosine kinase (AK), in the purine nucleotide salvage pathway were downregulated by morphine, which suggested that morphine inhibits purine nucleotide anabolism in cells. Other studies on primary cell cultures and cell lines from the brain in vitro demonstrated that morphine and other opioids often inhibit the synthesis of DNA and RNA[7–11].
Experiments have revealed that the metabolic problem of nucleic acid and nucleotides induced by morphine administration is an important subject. In order to clarify the effects and possible mechanism of morphine and heroin in nucleotide catabolism in vivo and in vitro, and to explore the biochemical pharmacological mechanism of morphine dependence, tolerance, and withdrawal, we sought to determine whether morphine exposure affects the metabolism of purine nucleotide in vivo and in vitro. In this study, the rat model of morphine dependence and withdrawal was established and rat C6 glioma cells were used. As adenosine is not only the intermediate of purine nucleotide metabolism, but also an important neuromodulator involved in both acute and chronic effect of opiates[12–14], we focused on AK and adenosine deaminase (ADA), 2 key enzymes of anabolism and catabolism of adenosine, respectively. However, ADA might be the predominant pathway for adenosine metabolism[15]. ADA and xanthine oxidase (XO) are 2 key enzymes regulating the catabolism of purine nucleotides. Therefore those 2 enzymes were chosen for the investigation of the biochemical pharmacology mechanism of morphine function.
Materials and methods
Animals and drug treatment Adult, female Wistar rats (n=50, Grade II, initial weight: 180±50 g, Jilin University Animal Laboratories, Jilin, China) were chosen for the study. The certificate number of the breeder was 3020086. The rats were housed under controlled environmental conditions with free access to food and water, and were randomly divided into 5 groups for the study. Each group of rats included 10 animals and was administered the drug by injection twice a day at 12 h intervals. The first group of rats was the control group, in which each rat was administered saline (ip) at the same dose as the daily morphine administration for 7 d. The second group was the 3 d morphine-administered group, in which each rat was administered morphine (ip) for 3 d with increasing daily doses; 20 mg/kg on d 1, 30 mg/kg on d 2, and 45 mg/kg on d 3. The third group was the 7 d morphine-administered group, in which each rat was administered morphine (ip) for 7 d with daily doses of 20, 30, 45, 55, 65, 85, and 95 mg/kg, respectively. The fourth and fifth groups of rats were for the morphine natural withdrawal investigation. Both groups of rats received the same dose of drugs as the third group. The fourth group of rats were euthanatized on the 11th day (3 d after morphine withdrawal), while the fifth group of rats were euthanatized on the 15th day (7 d after morphine withdrawal).
Cell culture C6 glioma cells were provided by the Shanghai Institute of Cell Research (China). The cells were maintained in monolayer culture at 37 °C and 5% CO2 in Dulbecco’s modified Eagle’s medium, plus 10% fetal calf serum (heat-inactivated). For all the experiments, the cells were treated with 0.25% trypsin on plastic culture flasks (5×10⁵ cells/mL). After overnight incubation, the culture medium was changed; the cells were replenished with fresh media and treated with opioid receptor agonist morphine (10 µg/mL) for a selected time course from 6 to 72 h in the first group. In the second group, the cells were pretreated with the opioid receptor antagonist naloxone (0.4 µg/mL diluted with the culture medium) for 1 h and then treated with naloxone plus morphine (10 µg/mL diluted with the culture medium) for 24 h. In the third group, the cells were pretreated with morphine (10 µg/mL diluted with the culture medium) for 1 h and then treated with naloxone plus morphine (10 µg/mL diluted with the culture medium) for 24 h. The cells were then washed with Phosphate-Buffered Salines (PBS), harvested and processed for RNA isolation with Trizol.
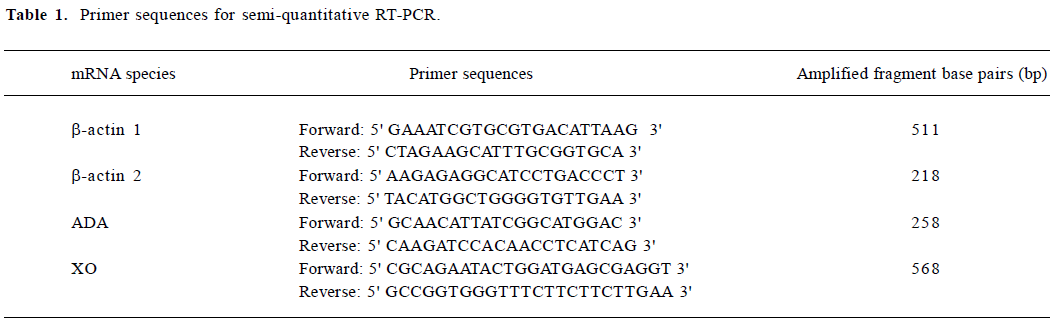
Reagents Morphine hydrochloride was provided by the First Pharmacy of Shenyang (Shenyang, China). Trizol was provided by Gibco BRL (Grand Island, NY, USA). Reverse transcriptase (MMLV-RT) and RNAsin were provided by Promega (Shanghai, China). Oligo-dT, dNTP, and Taq polymerase were provided by Dingguo (Beijing, China). The ADA and XO detection kits were provided by Nanjing Jiancheng Biotechnology (Nanjing, China). The uric acid detection kits, creatinine detection kits, and urea nitrogen detection kits were bought from Kehua Dongling Diagnostic Products (Shanghai, China). The specific primers used for RT-PCR are listed in Table 1. The pGEM-T easy vector and Prime-a-Gene labeling system were provided by Promega (Shanghai, China).
Full table
Uric acid detection The concentrations of plasma uric acid were measured by the uricase-rap method with uric acid detection kits as noted earlier.
Plasma creatinine detection The concentrations of plasma creatinine were measured by the sarcosine oxidase-rap method with creatinine detection kits as noted earlier.
Plasma urea nitrogen detection The concentrations of plasma urea nitrogen were measured by the UV-GLDH method with the urea nitrogen detection kits as noted earlier.
ADA detection Ten percent homogenates of the parietal lobe, liver, small intestine, and skeletal muscles were prepared, and concentrations of ADA in the plasma and tissues were measured by the ADA detection kits as noted earlier.
XO detection Ten percent homogenates of the parietal lobe, liver, small intestine, and skeletal muscles were prepared, and concentrations of XO in the plasma and tissues were measured by the XO detection kits as noted earlier.
RT-PCR for the evaluation of ADA mRNA transcripts Two µg total RNA isolated with Trizol from tissues was reverse transcribed in a volume of 15 µL. PCR was performed with 1 µL cDNA solution (representing about 0.1 µg cDNA). The PCR mixture contained PCR buffer (10 mmol/L Tris-HCl, pH 8.3; 50 mmol/L KCl, 1.5 mmol/L MgCl2, 0.001% [w/v] gelatin), 0.2 mmol/L dNTP, 50 pmol of each of the 5' and 3' primers for ADA, 25 pmol of the 5' and 3' β-actin 1 primers, and 2.5 units Taq polymerase in a total volume of 50 µL. The PCR reaction was carried out in a DNA thermal cycler. The amplification cycle for ADA denaturation was 95 °C for 35 s, annealing at 62 °C for 1 min, and extension at 72 °C for 1 min, and repeated for 35 cycles. The band intensity was quantified with a Kodak electrophoresis documentation analysis system (EDAS; New Haven, Connecticut, USA). The ratios of the intensity of bands of ADA/β-actin 1 were calculated to estimate the level of ADA mRNA transcripts.
RT-PCR-Southern hybridization for the evaluation of the XO mRNA transcript level RT-PCR was performed in the same way as mentioned earlier, except that 50 pmol of each of the 5' and 3' XO primers and 5' and 3' of the β-actin 2 primers were used. The amplification cycle for XO was 94 °C for 35 s, 60 °C for 1 min, and 72 °C for 1 min, with 30 repeated cycles.
Southern blot hybridization When 15 µL XO and β-actin 2 PCR products were electrophoresed on 1.5% agarose gel stained with ethidium bromide, only β-actin 2 products were observed; therefore, Southern hybridization was performed. The DNA was transferred to a nylon membrane. The blots were prehybridized in 5×SSPE (1×SSPE contains 0.15 mol/L NaCl, 0.01 mol/L NaH2PO4, 0.001 mol/L EDTA), 1% SDS and 10×Denhardt’s solution (1×Denhardt’s solution contains 0.02% polyvinylpyrrolidine, 0.02% ficoll 400, and 0.02% bovine serum albumin at 61 °C for 1 h. Internal XO cDNA obtained from previously made recombinant pGEM-T Easy vector was labeled with [α-32P]-dCTP according to the instructions included with the Prime-a-Gene labeling system, and was then added to the prehybridization buffer and hybridized at 65 °C for 16 h. The blots were washed twice at room temperature in 2×SSC (0.3 mol/L sodium chloride and 0.03 mol/L sodium citrate) with 0.1% SDS, then washed at 65 °C in 0.1×SSC with 0.1% SDS, and finally washed at room temperature in 0.1×SSC.
Statistical analysis Data were presented as mean±SD. Statistical significance was assessed by the paired t-test with significance assumed when P≤0.05.
Results
Plasma biochemical detection
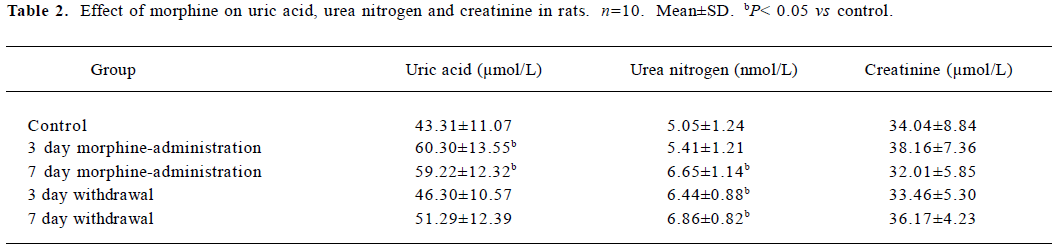
Uric acid detection There were significant increases in the concentrations of plasma uric acid in the rats administered with morphine for 3 and 7 d, as compared to the control group (P<0.05). During natural withdrawal, the concentrations of plasma uric acid in the rats exhibited a decreased tendency compared to the 7 d morphine-administered group, but were still higher than that of the control group (Table 2).
Full table
Urea nitrogen detection There was no increase of plasma urea nitrogen in the 3 d morphine-administered group when compared to the control, while the plasma urea nitrogen in the 7 d morphine-administered group and 2 withdrawal groups were significantly higher than that of the control (P<0.05; Table 2).
Creatinine detection Compared to the control group, there was no significant plasma creatinine enhancement in the morphine-administered and withdrawal groups (Table 2).
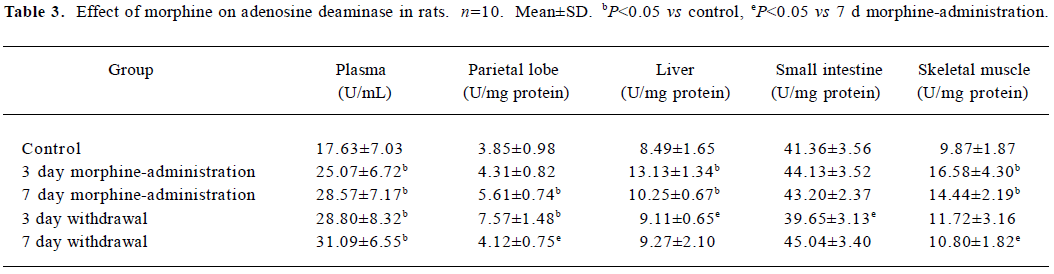
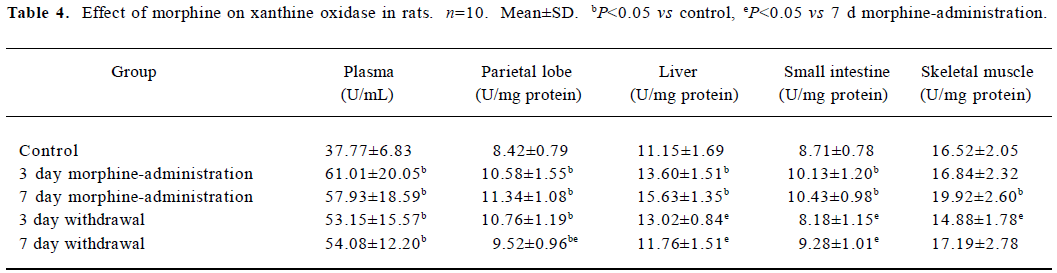
ADA and XO detection During morphine administration and natural withdrawal, plasma ADA and XO levels were all significantly higher than that of the control (P<0.05; Tables 3, 4).
Full table
Full table
Tissue ADA detection The activity detection of ADA in tissues found that morphine administration significantly increased the parietal lobe ADA in the 7 d morphine-administered group and in the 3 d natural withdrawal group when compared to the control (P<0.05). There was a significant increase of liver ADA in the morphine-administered rats when compared to the control (P<0.05), while the liver ADA in the withdrawal group recovered to the control level gradually. The level of small intestine ADA was higher in the 3 and 7 d morphine-administered groups and the natural withdrawal 7 d group than in the control group, but with no significant changes. There was a significant increase of skeletal muscle ADA in the morphine-administered groups compared to the control group (P<0.05), while the ADA levels were still higher in the natural withdrawal groups than in the control, but with no significant changes. Whereas, the ADA level in the natural withdrawal 7 d group was significantly lower than in the 7 d morphine-administered group (Table 3).
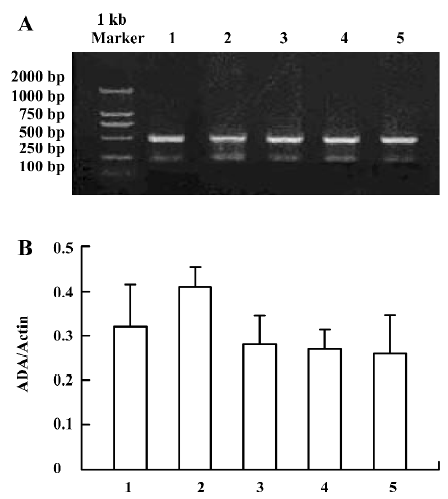
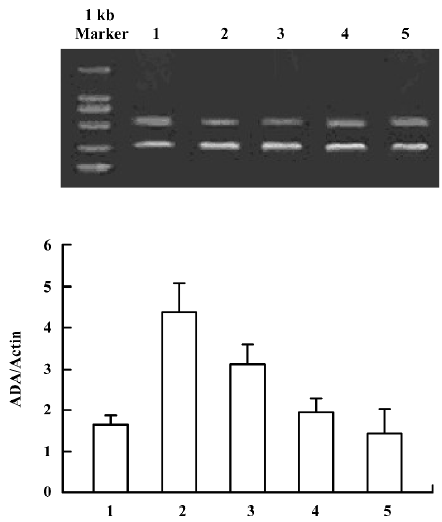
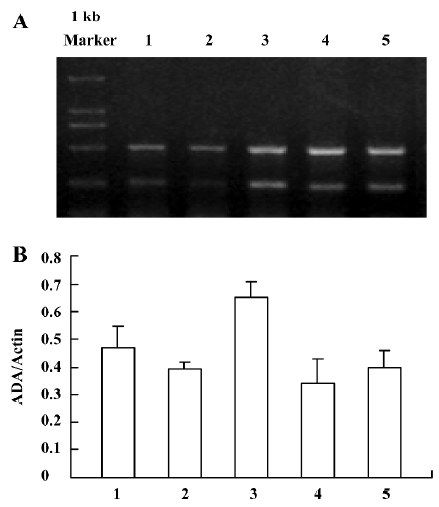
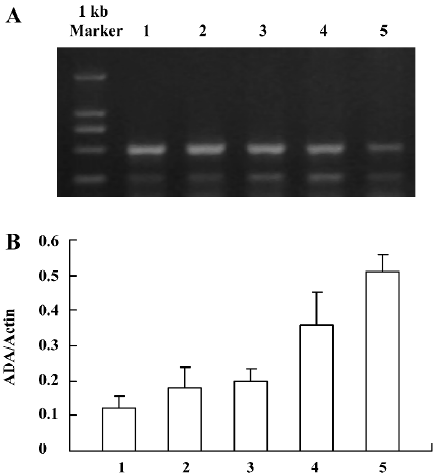
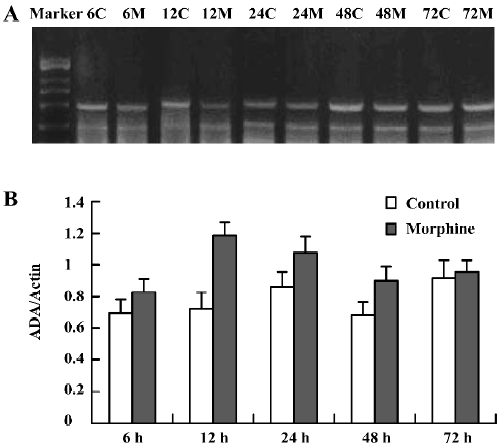
ADA mRNA detection showed a significant increase of the parietal lobe ADA mRNA levels in the 3 d morphine-administered group; however, there was no significant change of the parietal lobe ADA mRNA in the 7 d morphine-administered and natural withdrawal groups, compared to the control groups (Figure 1A, 1B). There was a significant increase of the liver ADA transcription level in the 3 and 7 d morphine-administered groups. Compared to the morphine-administered groups, the effect of morphine decreased gradually and the liver ADA mRNA levels recovered to the control level in the withdrawal groups (Figure 2A, 2B). There was significant upregulated transcription of small intestine ADA in the rats after treatment with morphine for 7 d. Compared to the controls, there were no significant changes of small intestine ADA mRNA in the natural withdrawal groups (Figure 3A, 3B). The ADA mRNA levels of the skeletal muscles were upregulated both in the morphine-administered groups and the natural withdrawal groups when compared to the control group (Figure 4A, 4B).
Tissue XO detection Activity detection of XO in tissues showed that during morphine administration and natural withdrawal, the amounts of parietal lobe XO were significantly higher than the control level (P<0.05). There was a significant increase of liver XO in the morphine-administered rats (P<0.05). Compared to the morphine-administered groups, the effect of morphine gradually decreased and the amount of liver XO decreased to the control level in the withdrawal groups (P<0.05). The amounts of small intestine XO in the 3 and 7 d morphine-administered groups were significantly higher than in the control group (P<0.05), while compared to the morphine-administered groups, the amounts of XO in the withdrawal group recovered to the control level gradually (P<0.05). There was a significant increase of skeletal muscle XO in the 7 day morphine-administered group as compared to the corresponding control group (P<0.05), while the amounts of XO in the withdrawal group gradually recovered to that of the control level (Table 4).
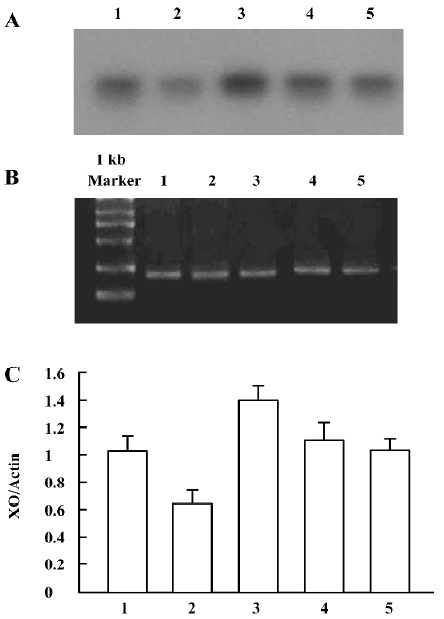
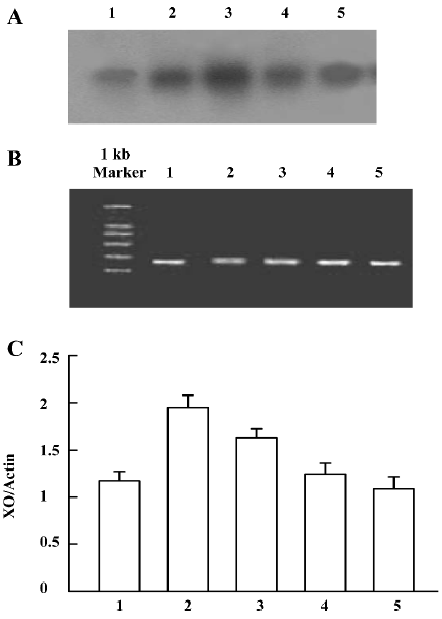
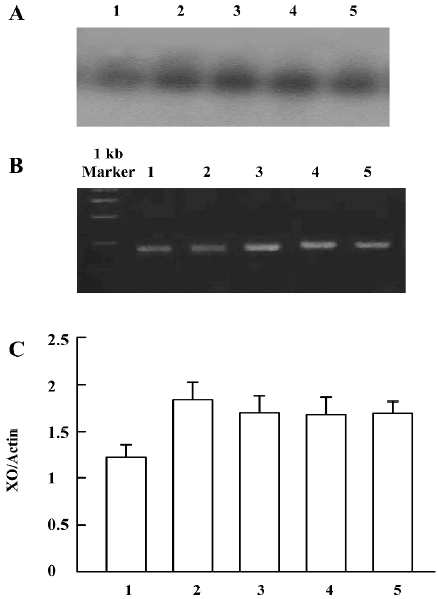
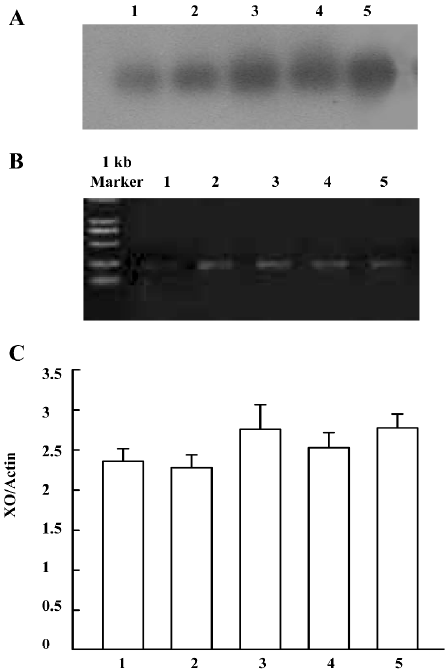
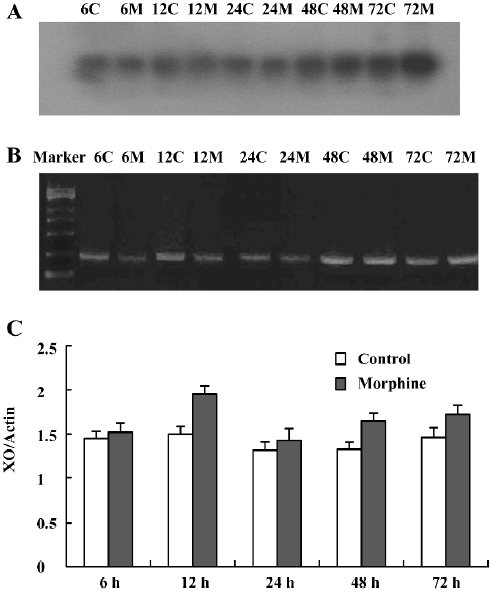
XO mRNA detection showed a significant increase of the parietal lobe XO mRNA in the 7 d morphine-administered group, but there was no significant change of the parietal lobe XO mRNA in the natural withdrawal groups, compared to the corresponding control group (Figure 5A–5C). There was a significant increase of liver XO mRNA levels in the 3 and 7 d morphine-administered groups. Compared to the morphine-administered groups, the effect of morphine gradually decreased and the liver XO mRNA levels recovered to the control level in the withdrawal groups (Figure 6A–6C). There were significant upregulation of small intestine XO mRNA in the morphine-administered and natural withdrawal groups compared to the control group (Figure 7A–7C). The amounts of skeletal muscle XO mRNA were upregulated in the 7 d morphine-administered and natural withdrawal groups compared to the control group (Figure 8A–8C).
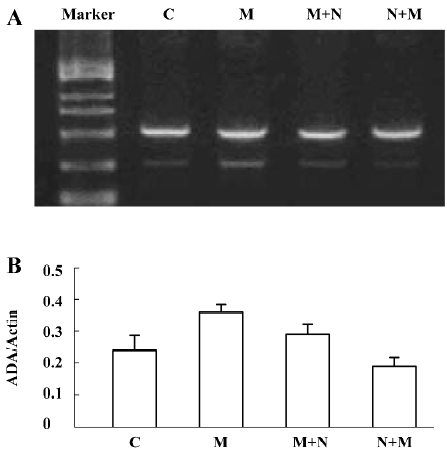
Detection of ADA mRNA in C6 cells Compared to the corresponding control, morphine treatment upregulated ADA mRNA in C6 cells. ADA mRNA was increased at all of the selected time courses after exposure to morphine (Figure 9A, 9B). When the cells were pretreated with naloxone for 1 h and then treated with morphine for 24 h, or pretreated with morphine for 1 h and then treated with naloxone for 24 h, the upregulation of ADA mRNA was prevented (Figure 10A, 10B).
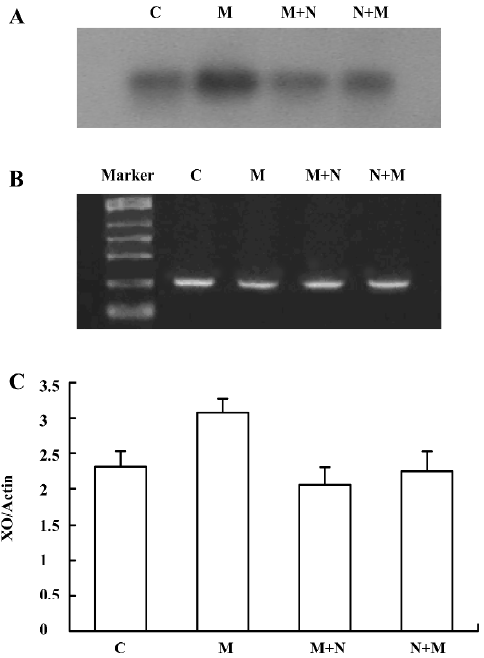
Detection of XO mRNA in C6 cells The [α-32P]-labeled specific XO cDNA probe hybridized with the RT-PCR product of the cells. The hybridizing signals were compared to the total intensity of β-actin 2 products stained on agarose by ethidium bromide. Compared with the corresponding period control cells, morphine upregulated XO mRNA in C6 cells. The XO mRNA increased at all selected time periods after exposure of the cells to morphine, (Figure 11A–11C). When the cells were pretreated with naloxone for 1 h and then treated with morphine for 24 h, or pretreated with morphine for 1 h and then treated with naloxone for 24 h, the upregulated transcription of XO was inhibited (Figure 12A–12C).
Discussion
In addition to their roles as the subunits of nucleic acids, purine nucleotides have a variety of other functions in every cell such as being energy carries, components of enzyme cofactors, and chemical messengers. Many experiments have showed that intracellular cAMP and cGMP regulation systems play an important role in the mechanisms of morphine dependence and withdrawal[16,17]. Recent papers have reported that tetrahydrobiopterin (BH4) is an essential cofactor for tyrosine hydroxylase, tryptophan hydroxylase, and nitric oxide (NO) synthase[18]. Dopamine and NO are important neurotransmitters. Many previous studies showed that their abnormality was concerned with morphine dependence and tolerance[19–22]. As GTP is the precursor of BH4, excessive catabolism and insufficient anabolism of purine nucleotides by morphine administration may cause serious subsequent effects in vivo.
Previous experiments have demonstrated that morphine administered intravenously increases the rate of efflux of purines from the intact rat cerebral cortex, and naloxone antagonized morphine’s action[23]. In addition, recent ex vivo and in vivo findings have shown that morphine increases uric acid concentrations in the rat striatum[24–26]. The reasons for uric acid concentration increases have not been explained. Uric acid is the final product of purine nucleotide catabolism in primates. While in some other species, including rodents, uric acid is the near terminal product which can be converted to allantoin[27]. The determination of plasma uric acid concentration may reflect the catabolism state of purine nucleotides. In this study, we found that there was a significant increase in plasma uric acid in morphine-administered rats, compared to the controls. This preliminary data suggest that morphine exposure may cause the enhancement of purine nucleotide catabolism. Our further study showed that the increase of uric acid concentration highly correlated with ADA and XO, 2 key enzymes of purine nucleotide catabolism. During morphine administration, the levels of plasma ADA and XO increased significantly when compared to the control (P<0.05), and after morphine withdrawal, the concentration of ADA and XO was still high. The high concentration of plasma ADA and XO might have resulted from the release of intracellular enzymes from 1 or more tissues into the blood; therefore, we determined the ADA and XO levels in several important tissues, including the brain, liver, small intestine, and skeletal muscles. The results indicated that morphine can increase the amounts of ADA and XO in these tissues, which is believed to contribute to the enhancement of purine nucleotide catabolism and the high level of plasma uric acid.
In order to investigate one of the possible mechanisms of morphine’s effect on ADA and XO, RT-PCR, and RT-PCR-Southern blot were used to examine the gene transcripts of ADA and XO in these tissues. Compared to the control group, the transcripts of ADA and XO were significantly higher in rats administered with morphine, while ADA and XO mRNA levels in most tissues gradually recovered to the normal during morphine abstinence. The changes of ADA and XO mRNA are paralleled with their enzymes, respectively.
Rat C6 glioma cells have been demonstrated to exhibit stable expression of the μ receptor and other opioid receptors, such as delta and kappa receptors. The μ receptor mainly mediates morphine dependence and tolerance[28–31]. We choose rat C6 glioma cells to try and clarify whether morphine affects the catabolism of purine nucleotides in vitro and to study the relationship between the transcripts of ADA and XO and the opioid receptors. The results suggested that ADA and XO gene expression were upregulated during morphine administration, whereas the upregulated expression of ADA and XO could be reversed by naloxone 1 h before or after morphine administration. As it is well known that naloxone is a pure, competitive antagonist of opioid receptors[32], the up-regulation of ADA and XO gene expression were probably mediated by opioid receptors.
Creatinine and urea nitrogen, sensitive indices reflecting the renal clearance rate, were detected to assess the impact of morphine on renal function. The results showed that the concentrations of plasma creatinine were not significantly changed in both the 3 and 7 d morphine-administered groups. Meanwhile, the concentrations of plasma urea nitrogen increased in the 7 d morphine-administered group, but the concentration of the plasma uric acid started to increase in the 3 d morphine-administered group, so the early enhancement of plasma uric acid might mainly result from the increase of purine nucleotides catabolism. Renal function might be affected by long-term morphine administration which may partly contribute to the late enhancement of plasma uric acid.
In our previous experiments we found that gene expression of the key enzymes, HGPRT and AK in the purine nucleotide salvage pathway are downregulated by morphine in vivo and in vitro, which is consistent with the findings that heroin treatment of cells inhibits the anabolism of purine nucleotides[6,33]. It is well known that there is no 5-phos-phoribosyl-1 pyrophosphate (PRPP) aminotransferase in the brain, and the anabolism of nucleotides mainly depends on the salvage pathway, and therefore, the ability of nucleotide anabolism is slower in the brain. This experiment demonstrated that morphine caused the increase of brain ADA and XO concentrations; the reinforcement of purine nucleotides catabolism induced by morphine did not disappear quickly, therefore, the effect of morphine on purine nucleotides catabolism in the brain is more serious.
In summary, acute and chronic morphine administration can increase the catabolism of purine nucleotide in the brain and extraneuronal tissues, and the effect of morphine on nucleotide catabolism remains for a period after withdrawal. The inhibitory effects of morphine on the anabolism of purine nucleotides in previous works and the promotive effects of morphine on the catabolism of purine nucleotide in this report imply that morphine may affect the nucleotide metabolism seriously. It is already known that purine products affect the normal development of neuron cells and that long-term administration of opioids may produce toxic effects on the central and peripheral nervous system, causing irreversible pathological changes in cells. Therefore, we propose that the effects of morphine on purine nucleotide metabolism may be an important, new biochemical pharmacological mechanism of morphine action, and the relationship between purine nucleotide metabolism and opioid addiction is worth further study.
Acknowledgement
This work was supported by Dr Jennifer STEWART of the Department of Biology, Virginia Commonwealth University, Richmond, VA, USA.
References
- Ling GSF, Spiegel K, Nishimura S, Pasternak GW. Dissociation of morphine’s analgesic and respiratory depressant actions. Eur J Pharm 1983;149:403-40.
- Jaffe JM, Martin WR. Opioid analgesics and antagonists. In: Gilman A, Rall J, Nies M, Taylor P, editors. The pharmacologic basis of therapeutics; 8th ed. New York: Pergamon Press; 1990. p 485–573.
- Jones KL, Barr GA. Ontogeny of morphine withdrawal in the rat. Behav Neurosci 1995;109:1189-98.
- Bilsky EJ, Bernstein RN, Wang Z, Sadée W, Porreca F. Effects of naloxone and D-Phe-Cys-Tyr-D-Trp-Arg-Thr-Pen-Thr-NH2 and the protein kinase inhibitors H7 and H8 on acute morphine dependence and antinociceptive tolerance in mice. J Pharm Exp Ther 1996;277:484-90.
- Yang YD, Zhang JZ, Sun C, Yu HM, Li Q, Hong M. Heroin affects purine nucleotides catabolism in rats in vivo. Life Sci 2006;13:1413-8.
- Liu JK, Hong M, Zhao XD. Effect of morphine on gene expression of gene of enzymes related to purine nucleotide metabolism in c6 glioma. Natl Med J China 2003;83:46-51.
- Stiene-Martin A, Hauser KF. Morphine suppresses DNA synthesis in cultured murine astrocytes from cortex, hippocampus and striatum. Neurosci Lett 1993;157:1-3.
- Hauser KF. Morphine regulates DNA synthesis in rat cerebellar neuroblasts in vitro. Brain Res Dev Brain Res 1992;70:291-7.
- Nassiri MR, Flynn GL, Shipman C Jr. Inhibition of cell growth and DNA, RNA, and protein synthesis in vitro by fentanyl, sufentanil, and opiate analgesics. Pharmacol Toxicol 1991;69:17-21.
- Jacobs EH, Smit AB, de Vries TJ, Schoffelmeer AN. Long-term gene expression in the nucleus accumbens following heroin administration is subregion-specific and depends on the nature of drug administration. Addict Biol 2005;10:91-100.
- Kahn L, Alonso G, Normand E, Manzoni OJ. Repeated morphine treatment alters polysialylated neural cell adhesion molecule, glutamate decarboxylase-67 expression and cell proliferation in the adult rat hippocampus. Eur J Neurosci 2005;21:493-500.
- Coupar IM, Tran BL. Withdrawal and bidirectional cross-withdrawal responses in rats treated with adenosine agonists and morphine. Life Sci 2001;69:779-90.
- Sawynok J, Liu XJ. Adenosine in the spinal cord and periphery: release and regulation of pain. Prog Neurobiol 2003;69:313-40.
- Agteresch HJ, Dagnelie PC, van den Berg JW, Wilson JH. Adenosine triphosphate: established and potential clinical applications. Drugs 1999;58:211-32.
- Golembiowska K, White TD, Sawynok J. Modulation of adenosine release from rat spinal cord by adenosine deaminase and adenosine kinase inhibitors. Brain Res 1995;699:315-20.
- Bie B, Peng Y, Zhang Y, Pan ZZ. cAMP-mediated mechanisms for pain sensitization during opioid withdrawal. J Neurosci 2005;25:3824-32.
- Liang DY, Clark JD. Modulation of the NO/CO-cGMP signaling cascade during chronic morphine exposure in mice. Neurosci Lett 2004;15:73-7.
- Serova LI, Maharjan S, Huang A, Sun D, Kaley G, Sabban EL. Response of tyrosine hydroxylase and GTP cyclohydrolase I gene expression to estrogen in brain catecholaminergic regions varies with mode of administration. Brain Res 2004;1015:1-8.
- Zocchi A, Girlanda E, Varnier G, Sartori I, Zanetti L, Wildish GA. Dopamine responsiveness to drugs of abuse: A shell-core investigation in the nucleus accumbens of the mouse. Synapse 2003;50:293-302.
- Tassin JP. Role of dopamine in drug dependence processes. Bull Acad Natl Med 2002;186:295-305.
- Pryor SC, Zhu W, Cadet P, Bianchi E, Guarna M, Stefano GB. Endogenous morphine: opening new doors for the treatment of pain and addiction. Expert Opin Biol Ther 2005;5:893-906.
- Rezayof A, Amini R, Rassouli Y, Zarrindast MR. Influence of nitric oxide on morphine-induced amnesia and interactions with dopaminergic receptor agents. Physiol Behav 2006;88:124-31.
- Phillis JW, Jiang ZG, Chelack BJ, Wu PH. Morphine enhances adenosine release from the in vivo rat cerebral cortex . Eur J Pharmacol 1980;65:97-100.
- Enrico P, Esposito G, Mura MA, Migheli R, Serra PA, Desole MS, et al. Effects of allopurinol on striatal dopamine, ascorbate and uric acid during an acute morphine challenge: ex vivo and in vivo studies. Pharmacol Res 1997;35:577-85.
- Enrico P, Esposito G, Mura MA, Fresu L, De Natale G, Miele E, et al. Effect of morphine on striatal dopamine metabolism and ascorbic and uric acid release in freely moving rats. Brain Res 1997;745:173-82.
- Enrico P, Mura MA, Esposito G, Serra P, Migheli R, De Natale G, et al. Effect of naloxone on morphine-induced changes in striatal dopamine metabolism and glutamate, ascorbic acid and uric acid release in freely moving rats. Brain Res 1998;797:94-102.
- Robert K, Daryl K, Peter A, Victor W. Harper’s Biochemistry. 25th ed. New York: McGraw-Hill Publishers; 2000.
- Bohn LM, Belcheva MM, Coscia CJ. Evidence for µ-opioid receptor expression in C6 glioma cells. J Neurochem 1998;70:1819-25.
- Emmerson PJ, Clark MJ, Mansour A, Akil H, Woods JH, Medzihradsky F. Characterization of opioid agonist efficacy in a C6 glioma cell line expressing the mu opioid receptor. J Pharmacol Exp Ther 1996;278:1121-7.
- Loh HH, Tao PL, Smith AP. Role of receptor regulation in opioid tolerance mechanisms. Synapse 1988;2:245-6.
- Contet C, Kieffer BL, Befort K. Mu opioid receptor: a gateway to drug addiction. Curr Opin Neurobiol 2004;14:370-8.
- Laurence DR, Bennett PN, Brown MJ. Clinical Pharmacology; 8th ed. New York: Harcourt Publishers; 1997.
- Yan XK, Hong M, Liu C, Niu S. Effect of morphine on purine nucleotides metabolism in gene level. Chin J Drug Depend 2005;14:187-9.