
Difference in oral absorption of ginsenoside Rg1 between in vitro and in vivo models
Introduction
Ginsenoside Rg1 (Rg1), the main ingredient of Panax notoginseng saponins (PNS; an important traditional Chinese medicine), has been proven in recent years to possess a number of pharmacological effects, including partial protection against the excitotoxic effect of glutamate in primary hippocampal cultures[1], a partial neurotrophic and neuroprotective role in dopaminergic cell culture[2], an ameliorating effect on performance impairment induced by scopolamine[3], and a protective effect on experimental myocardial injury induced by ischemia and reperfusion in rats[4].
Rg1 is poorly absorbed when administered orally, but in addition to factors such as solubility and dissolution related to its high aqueous solubility, it is possible that other factors contribute to its poor absorption. It has been reported in recent years that Rg1 is decomposed in gastric juice[5] and transformed into 20(S)-protopanaxatriol (20S-Ppt) via ginsenoside Rh1 by enteric bacteria in rats and humans[5–9]. This suggests the instability of Rg1 in the stomach and large intestine. The pharmacokinetics of Rg1 in rats have been studied through TLC and the results show that little Rg1 is absorbed from the digestive tract[5,10]. Rg1 has been reported to be efficiently taken up by the rat liver and secreted into bile, and 57.2%±1.7% of the dose was found to be excreted into bile within 4 h after iv administration at a dose of 5 mg/kg[11]. However, what remains unknown is the transport mechanism across the intestinal mucosa and the first-pass effects of the stomach, intestine and liver which are involved in the absorption process. In order to improve the oral absorption of Rg1, it is necessary to clarify the absorption mechanism systematically.
The first-pass effects of the stomach, intestine and liver can be evaluated by comparing the absolute bioavailability (Fpo, Fid and Fpv respectively), which are calculated by dividing the area under the serum concentration versus time curve (AUC) after po, id, and pv administration by the AUC after iv administration[12,13]. Because PNS is used more widely in practice than Rg1 alone, both Rg1 and PNS (Rg1 content of 27.36%) are investigated in the present study.
Materials and methods
Materials PNS was purchased from Kunming Pharmaceutical Co (Kunming, China). Standard ginsenoside Rg1 was purchased from the National Institute for the Control of Pharmaceutical and Biological Products, China. Cyclosporin A (CsA) was obtained from the Guangdong Medicine Group Co, Ltd (Guangzhou, China). The Caco-2 cell line was obtained from the American Type Culture Collection (Rockville, MD, USA) at passage 35. Cell culture media and reagents including fetal bovine serum were purchased from Gibco (Grand Island, NY, USA). Permeable polycarbonate inserts and Millicell-ERS (electrical resistance system) were purchased from Millipore (Bedford, MA, USA). All other chemicals and reagents were of analytical or high performance liquid chromatography (HPLC) grade as appropriate.
Caco-2 cell culture Caco-2 cells at passages 35–42 were used in the experiments and grown in Dulbecco’s modified Eagle’s medium (DMEM) supplemented with 10% fetal bovine serum, 1% L-glutamate, 1% nonessential amino acids and 1% penicillin streptomycin solution at 37 °C in 75-cm2 flasks (Costar) in a humidified air-5% CO2 atmosphere. After being harvested with trypsin-ethylenediamine tetraacetic acid (EDTA), cells in suspension (2.5×10⁵ cells/mL) were seeded onto 6-well plates for Rg1 uptake studies (2 mL/well) and on permeable polycarbonate inserts (4.2 cm2, 0.40 µm pore size) in 6-well plates (Nunc, Roskilde, Denmark) for transepithelial transport studies (1 mL cell suspension in the apical compartment and 2 mL culture medium in the basolateral compartment). Cells were cultured for 14 d for uptake studies and 20–22 d for transepithelial transport studies after seeding. The transepithelial electrical resistance (TEER) of the Caco-2 cell monolayers was examined routinely before and after the experiment using the Millicell-ERS system to assess the integrity of monolayers grown on the permeable membrane in the transepithelial transport studies. The monolayers were used when TEER exceeded 500 Ω·cm2.
Uptake studies Rg1 uptake was measured using monolayers grown in 6-well plates. The uptake medium consisted of Hanks’ balanced salt solution (HBSS) with calcium and magnesium, 25 mmol/L D-glucose, 20 mmol/L N-2-hydroxyethylpiperazine-N’-2-ethanesulfonic acid (HEPES; adjusted to pH 7.0 or 7.4 with 1 mol/L HCl) or 2-N-morpholine-ethanesulfonic acid (MES; adjusted to pH 5.5, 6.0 or 6.5 with 1 mol/L NaOH). The medium pH was measured and adjusted after addition of all compounds tested in uptake studies. For Rg1 uptake measurements, cells were washed with HBSS (3×2 mL) at the appropriate pH and preincubated for 15 min in 2 mL HBSS at controlled temperatures (4 or 37 °C). The medium was discarded, and Rg1 uptake was studied after various incubation times at different final concentrations. Cyclosporin A was added to the incubation medium on the cell monolayers to investigate its effect on Rg1 uptake. At the end of the incubation period, the incubation solution was aspirated and the monolayers were carefully rinsed with ice-cold HBSS. Each Caco-2 cell monolayer was collected with 1 mL HBSS and frozen (at -80 °C) then thawed (at room temperature) 3 times, and then the cells were lysed ultrasonically. After the solubilized monolayers were centrifuged at 9000×g for 10 min, the supernatants were collected and 10 µL was used to determine the Rg1 concentration using HPLC. Results were expressed as µg of Rg1 per mg of protein. The protein contents of the cell monolayers were determined by using Coomassie staining.
Transepithelial transport study For Rg1 transepithelial flux measurement, Caco-2 cell monolayers were washed 3 times with prewarmed (37 °C) HBSS prior to the experiments. Then the monolayers were preincubated at 37 °C for 15 min in a CO2 incubator with warm (37 °C) HBSS (pH 6.5 and 7.4 for the apical and basolateral compartments, respectively). The TEER was measured to ensure that the epithelium was tight, and the HBSS solution on both sides of the cell monolayers was then removed by aspiration. Rg1 or PNS was added to either the apical (1.5 mL; pH 6.5) or basolateral (2 mL; pH 7.4) compartments. At various times, samples (200 µL) were taken from the opposite compartment followed by immediate replacement with fresh HBSS of the same volume (200 µL). Ten microliters was used to determine the Rg1 concentration using HPLC. All experiments were conducted in triplicate. Results were expressed as µg of Rg1 transported per cm2 of epithelium.
The drug transport capacity of the epithelium was quantified by calculating the apparent permeability coefficient (Papp) that reflects the passage velocity of the drug through the epithelium. Papp was calculated as follows:
Papp=(dQ/dt)/(A×C0)
where dQ/dt is the drug permeation rate (µg/s), A is the surface area of epithelium (cm2), and C0 is the initial concentration in the donor compartment (µg/cm3).
First-pass effects of Rg1 The first-pass effects of Rg1 were evaluated after po, id, pv and iv administration of PNS to rats. Male Sprague-Dawley rats weighing 250–300 g were used. They were fasted with free access to water for 20 h prior to po and id administration. For iv administration, PNS dissolved in 0.9% NaCl solution (50 mg/mL) was given via the tail vein at a dose of 50 mg/kg. For pv administration, the rats were anesthetized lightly with diethyl ether, the portal vein was surgically exposed, and PNS dissolved in 0.9% NaCl solution (50 mg/mL) was delivered into the portal vein through the mesenteric vein over 15 s at a dose of 50 mg/kg. For po and id administration, PNS dissolved in water was administered perorally at doses of 600 mg/kg or 1500 mg/kg (dose volume 6 mL/kg), and intraduodenally at doses of 600, 900 or 1200 mg/kg (dose volume 4 mL/kg). Blood samples were collected from the eye socket at 0.08, 0.25, 0.5, 1, 2, 4, 8, 12, 24, 48, and 72 h after iv and pv administration of Rg1, 0.25, 0.5, 1, 1.5, 2, 4, 6, 8, 12, 24, and 72 h after po administration of Rg1, 0.25, 0.5, 0.75, 1, 2, 4, 8, 12, 24, 72 h after id administration of Rg1. Serum samples were obtained by centrifugation at 4000×g for 10 min after the blood collection, and the serum concentration of Rg1 was determined by HPLC.
Model-independent methods based on the theory of statistical moments were used to characterize the pharmacokinetics of Rg1 after iv, id, pv and po administration of Rg1. AUC and mean residence time (MRT) were calculated by numerical integration under the trapezoidal rule as described by Yamaoka et al[14]. Because this was observed over a limited period of time (72 h), extrapolation to time=infinity was carried out using a monoexponential equation. The absolute bioavailability (F) of Rg1 was calculated by dividing AUC after po, id, and pv administration by the AUC after iv administration.
Determination of Rg1 by HPLC Solid phase extraction (SPE) cartridges (Oasis, Waters, USA) were conditioned under vacuum with 1 mL of methanol and 1 mL of water. Then, 200 µL of serum samples were mixed with 4 µL of 85% (v/v) phosphoric acid, and centrifuged at 9000×g for 10 min. A volume of 100 µL of supernatant was applied to the SPE cartridges and drawn through under low vacuum (10–15 in Hg). Cartridges were washed with 1 mL of 5% (v/v) methanol aqueous solution, eluted with 1 mL of methanol and evaporated to dryness under a nitrogen stream at 40 °C. Finally, the residues were reconstituted in 100 µL of the mobile phase and 10 µL was used for HPLC.
HPLC was carried out using a YMC ODS C18 column (5 µm, 4.2 ID×150 mm, Japan) with a liquid chromatograph (LC-10AT; Shimadzu, Japan) and a UV-VIS Detector (SPD-101; Shimadzu) at 203 nm, and a data workstation system (HS2000; Hangzhou Empire, Hangzhou, China). A mobile phase at a speed of 1 mL/min consisting of acetonitrile with 20 mmol/L NaH2PO4 (32:68, v/v) was used for chromatographic resolution. The peak area was linearly related to the amount of Rg1 over the range of 10.8–432 ng. The within-day precision of determination of Rg1 in rat serum by using HPLC was 3.45%, 6.36%, and 4.66% for 21.6, 108, and 432 ng Rg1, respectively. The between-day precision of determination of Rg1 in rat serum by HPLC was 5.40%, 9.18%, and 7.32% for 21.6, 108, and 432 ng Rg1 respectively. The recovery of Rg1 in rat serum were 85.24%±2.96%, 86.11%±5.48%, and 81.61%±3.80% for 21.6, 108, and 432 ng Rg1, respectively.
Statistical analysis Values are expressed as mean±SD. The difference among mean values was analyzed by using the two-tailed Student’s t-test and comparisons among more than 3 groups were performed by using one-way ANOVA. P<0.05 was considered to be significant.
Results
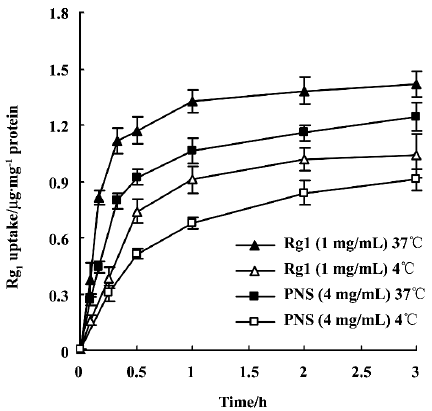
Uptake of Rg1 by Caco-2 cell monolayers Rg1 (1 mg/mL) and PNS (4 mg/mL) uptake by Caco-2 cell monolayers was studied at 37 °C and 4 °C. The intracellular amounts sharply increased during the first 30 min and reached almost a steady state afterwards (Figure 1). For both Rg1 alone and Rg1 in PNS, uptake was temperature-dependent, and intracellular Rg1 amounts measured at 37 oC were approximately 1.5-fold higher than those at 4 °C.
In addition, the pH-dependence of Rg1 (or PNS) uptake was examined. No significant difference was observed when Caco-2 cell monolayers were incubated with Rg1 (or PNS) solution at different pH levels (pH 5.5, 6.0, 6.5, 7.0, 7.4; Table 1). Given the weak acid microclimate that exists above the epithelial cell layer in the upper part of the small intestine[15], the following studies were performed at pH 6.5 on the apical side of the monolayer.
Full table
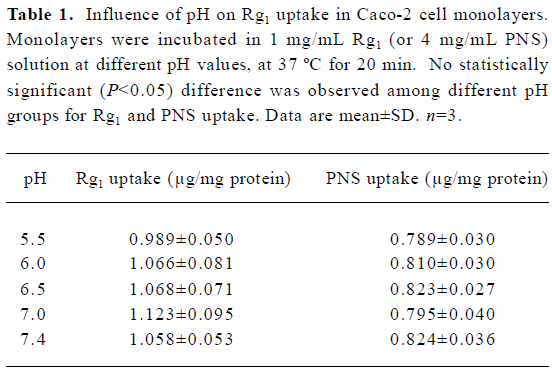
The concentration-dependence of uptake of Rg1 by Caco-2 cell monolayers was examined. The intracellular amounts of Rg1 at 37 °C and 4 °C increased linearly with the increase in concentration over the range of 0.25 mg/mL to 5 mg/mL for Rg1, and 1 mg/mL to 40 mg/mL for PNS (Figure 2), which indicates passive membrane diffusion.
CsA was used as a P-gp and MRP inhibitor to investigate the role of efflux transporters in Rg1 uptake. In the absence and presence of CsA (50 µmol/L), Rg1 uptake was 1.027±0.056 and 0.986±0.093 μg/mg protein, respectively, for 1 mg/mL Rg1 solution (n=3), and 0.826±0.055 and 0.840±0.054 µg/mg protein, respectively, for 4 mg/mL PNS solution (n=3). No effect was observed when CsA was present. The results further confirmed that Rg1 uptake was not mediated by the efflux transporters in Caco-2 cell monolayers.
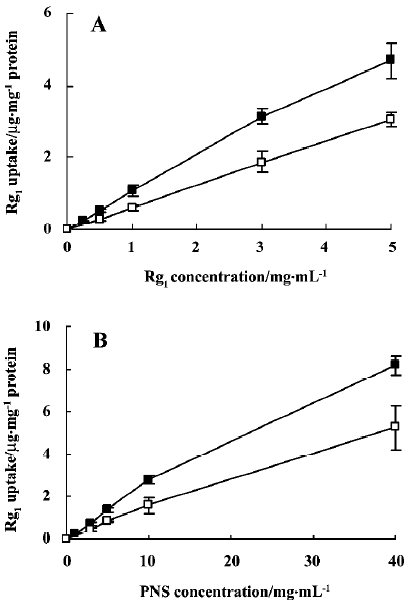
Transepithelial transport studies Rg1 transepithelial transport across Caco-2 cell monolayers was measured to evaluate intestinal permeability. Transport velocity from the apical to the basolateral (A–B) compartment was approximately constant during the whole kinetic study at 37 °C (Figure 3). The amount of Rg1 cumulative transepithelial flux through Caco-2 cell monolayers over 180 min increased linearly with increasing concentration in the apical compartment. Papp was (2.66±0.41)×10-7, (2.44±0.09)×10-7 (2.59±0.17)×10-7 and (2.19±017)×10-7 cm/s when the initial Rg1 concentration in apical compartment was 0.2, 0.5, 1.0, and 3.0 mg/mL, respectively (n=3). In the presence of CsA (50 µmol/L), Papp(A–B) was (2.45±0.20)×10-7 cm/s when Rg1 was 1 mg/mL (n=3). Thus, the Papp(A–B) of Rg1 was not significantly different at any concentration tested or in the presence of CsA. However, the Papp(B–A) was (1.13±0.11)×10-7 cm/s when Rg1 was 1 mg/mL in the basolateral compartment (n=3), which is significantly lower than that of A–B transport (P<0.05).
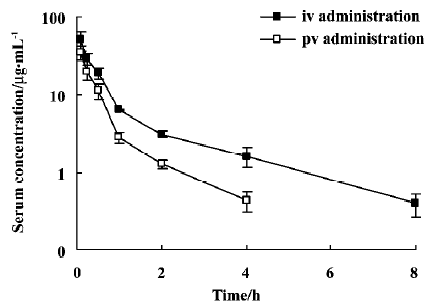
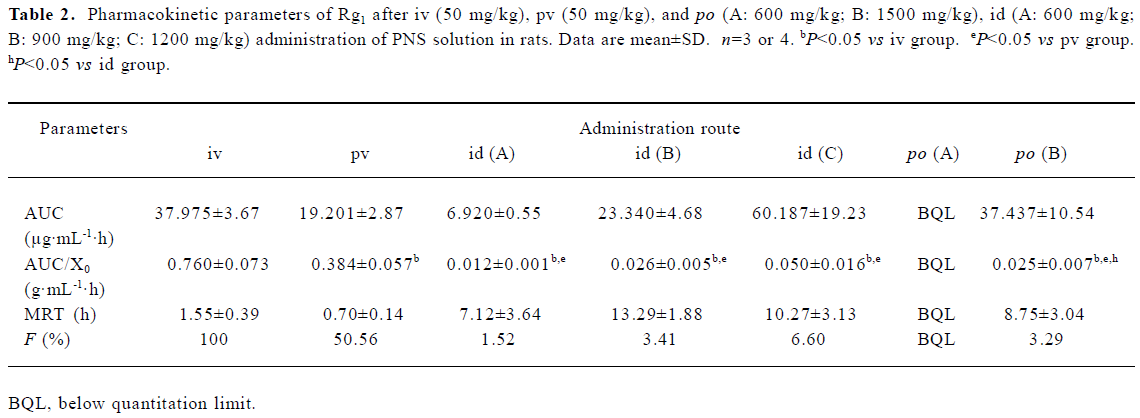
Gastric, intestinal and hepatic first-pass effects of Rg1 The gastric, intestinal and hepatic first-pass effects were evaluated after po, id, pv and iv administration. Figure 4 shows the serum concentration-time profiles of Rg1 after iv and pv administration of PNS. For each route of administration, 2 phases of decline were observed: a rapid decline followed by a slow decline, which could be described by a 2-compartment model. The pharmacokinetic parameters are listed in Table 2. AUC0–8 of Rg1 after pv administration of PNS (50 mg/kg) in rats was lower (approximately 49.44%) than that after iv administration of PNS (50 mg/kg). This indicates that part of the dose disappeared (may be due to biliary excretion) following the first pass through the liver after pv administration. After pv administration, the MRT0−8 value decreased by approximately 50% compared with iv administration, which could be due to the hepatic first-pass effect after pv administration.
Full table
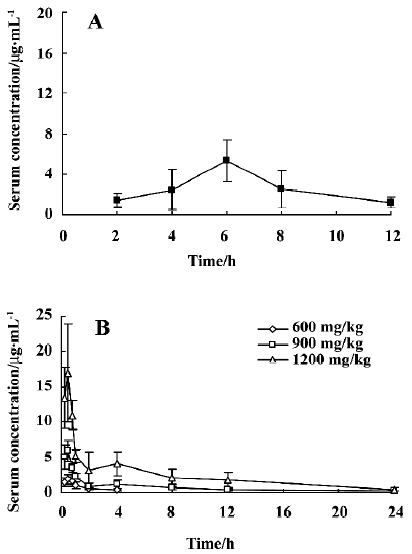
After po administration of PNS at a dose of 600 mg/kg, no Rg1 could be detected in serum samples. However, after po administration of 1500 mg/kg PNS in rats, the serum concentration of Rg1 was low, could be detected 2 h after administration, and reached a peak (5.38 µg/mL) 6 h after administration (Figure 5). Absolute bioavailability (Fpo) was estimated to be 3.29%. After id administration of PNS at doses of 600 mg/kg, 900 mg/kg and 1200 mg/kg in rats, absolute bioavailability (Fid) was, respectively, 1.52%, 3.41%, and 6.60% (Figure 5). For a dose of 600 mg/kg PNS administered via the iv route, the serum concentration was below quantification limits more than 8 h after id administration. Thus, a comparison of Fpo with Fid, and Fid with Fpv shows that the gastric and intestinal first-pass effects are both significant.
Discussion
Modulation of Rg1 uptake by a P-glycoprotein (P-gp; or MRP)-related efflux mechanism or enzymatic degradation in Caco-2 monolayers as possible explanations for the low Rg1 uptake were excluded in the present study because we observed neither concentration-dependence for Rg1 uptake nor any effect of co-administration of CsA on the Rg1 uptake.
The Rg1 uptake by Caco-2 cell monolayers was pH-independent, and greater uptake occurred at 37 °C compared with that at 4 °C. This temperature-dependence of uptake might be attributed to the cell membranes being more rigid at low temperatures, leading to a lower level of diffusion through the membrane[16].
In the transepithelial transport study, the flux of Rg1 in the A–B direction increased in a linear fashion with increasing concentration in the apical compartment, and no significant difference was observed after the addition of CsA. These results confirm that Rg1 is passively transported across Caco-2 cell monolayers. Papp(A–B) was approximately 2-fold greater than Papp(B–A). This polarized transport occurring in Caco-2 cell monolayers may result from the differences in physiological structure between the apical (A) and basolateral (B) membranes. Papp(A–B) was estimated to be (2.59±0.17)×10-7 cm/s (C0=1 mg/mL), which is below the suggested threshold value (1×10⁻⁵ cm/s) for poorly absorbed drugs[17]. The relatively large molecular weight (Mr=801) and low lipophilia value (we found that log P, the log value of the coefficient between water and octanol, was 0.64) of Rg1 may be partly responsible for its low permeability.
After pv administration of PNS in rats, serum concentration-time profiles of Rg1 were found to be similar to those observed with iv administration, but the AUC value decreased, which may have been caused by bile excretion following the first pass through the liver. For po administration of PNS at a dose of 1500 mg/kg, a delayed peak in serum concentration of Rg1 can be attributed to the low rate of absorption or the potential specific absorptive sites in the lower part of the intestine instead of biliary excretion, because the amount of biliary excretion is small compared with the po dose given in this instance. In contrast, few serum samples could be quantified after po administration of PNS at a dose of 600 mg/kg. With id administration, rapid absorption and a short time to peak serum concentration was observed, which was caused by the high concentration in the local area when PNS was directly delivered to the duodenum. Owing to the saturation of the enzymes in the intestinal tract when a higher dose was administered, absorption of Rg1 after id administration is dose-dependent, and the absolute bioavailability values were 1.52%, 3.41% and 6.60% for dosages of 600 mg/kg, 900 mg/kg and 1200 mg/kg, respectively.
As a result, the gastric first-pass effect is significant when Fpo (3.29% at a dose of 1500 mg/kg PNS) is compared with Fid (6.60% at a dose of 1200 mg/kg PNS), probably relating to the decomposition of Rg1 in the acid pH of the stomach[5]. However, although the gastric first-pass effect is significant, a large amount of Rg1 remains intact after po administration and moves into the intestinal tract, which may also induce saturation of enzymes in the intestinal tract and produce a similar F value to id administration at a relative low dose. Consequently, the primary reason for poor absorption of Rg1 can be attributed to the intestinal first-pass effect, because Fid is still extremely low (6.60% at a dose of 1200 mg/kg PNS), and approximately 7–8 times lower than Fpv (50.56%). There are two factors that account for the intestinal first-pass effect. One is metabolism by bacterial β-glucuronidase in the large intestine, but this is not a key factor, because the enzymatic reaction with microflora takes place mainly in the large intestine, but the small intestine is known to be a more important location in the absorption process. Furthermore, it is the low permeability across the intestinal mucosa of Rg1 that mainly accounts for its poor absorption before reaching the portal vein. This is consistent with the results of our Caco-2 cell studies, in which an extremely low Papp indicated a poor membrane permeability for Rg1.
Therefore, the low bioavailability of Rg1 is caused by its decomposition in the stomach, metabolism in the large intestine, low membrane permeability across the intestinal mucosa and elimination in the liver. Of these factors, low membrane permeability is the dominant factor explaining the poor absorption of Rg1.
References
- Liu M, Zhang JT. Protective effects of ginsenoside Rb1 and Rg1 on cultured hippocampal neurons. Acta Pharm Sin 1995;30:674-8.
- Radad K, Gille G, Moldzio R, Saito H, Rausch WD. Ginsenosides Rb1 and Rg1 effects on mesencephalic dopaminergic cells stressed with glutamate. Brain Res 2004;1021:41-53.
- Yamaguchi Y, Higashi M, Kobayashi H. Effects of ginsenosides on impaired performance caused by scopolamine in rats. Eur J Pharmacol 1996;312:149-51.
- Li X, Chen JX, Sun JJ. Protective effects of Panax notoginseng saponins on experimental myocardial injury induced by ischemia and reperfusion in rat. Acta Pharmacol Sin 1990;11:26-9.
- Takino Y. Studies on the pharmacodynamics of ginsenoside-Rg1, -Rb1 and -Rb2 in rats. Yakugaku-Zasshi 1994;114:550-64.
- Kanaoks M, Akao T, Kobashi K. Metabolism of ginseng saponins, ginsenoside, by human intestinal flora. Wakan Ryakugaku Zasshi 1994;11:241-6.
- Hasegawa H, Sung JH, Matsumiya S, Uchiyama M. Main ginseng saponin metabolites formed by intestinal bacteria. Planta Med 1996;62:453-7.
- Yi Wang, Liu TH, Wang W, Wang BX. Studies on the metabolism of ginsenoside Rg1 by intestinal bacteria and its absorbed metabolites in rat and human serum. Acta Pharm Sin 2000;35:284-8.
- Yi Wang, Liu TH, Wang W, Wang BX. Research on the transformation of ginsenoside Rg1 by intestinal flora. China J Chin Materia Med 2001;26:188-90.
- Odani T, Tanizawa H, Takino Y. Studies on the absorption, distribution, excretion and metabolism of ginseng saponins. II. The absorption, distribution and excretion of ginsenoside Rg1 in the rat. Chem Pharm Bull 1983;31:292-8.
- Artursson P, Palm K, Luthman K. Caco-2 monolayers in experimental and theoretical predictions of drug transport. Adv Drug Deliv Rev 2001;46:27-43.
- Azuma R, Hirota T, Manabe H, Komuro M, Kiwada H. First-pass of GTS-21 on canine gut wall and liver determined by portal-systemic concentration difference. Eur J Pharm Sci 2001;14:159-65.
- Kim SH, Lee MG. Pharmacokinetics of ipriflavone, an isoflavone derivative, after intravenous and oral administration to rats: hepatic and intestinal first-pass effects. Life Sci 2002;70:1299-315.
- Yamaoka K, Nakagava J, Uno T. Statistical moments in pharmacokinetics. J Pharmacokinet Biopharm 1978;6:547-57.
- Yamashita S, Furubayashi T, Kataoka M, Sakane T, Sezaki H, Tokuda H. Optimized conditions for prediction of intestinal drug permeability using Caco-2 cells. Pharm Sci 2000;10:195-204.
- Brunet JL, Maresca M, Fantini J, Belzunces LP. Human intestinal absorption of imidacloprid with Caco-2 cells as enterocyte model. Toxicol Appl Pharm 2004;192:1-9.
- Rubas W, Zezyk N, Grass GM. Comparison of the permeability characterization of human colonic epithelium (Caco-2) cell line to colon of rabbit, monkey and dog intestine and human drug absorption. Pharm Res 1993;10:113-8.