
Predicting MDCK cell permeation coefficients of organic molecules using membrane-interaction QSAR analysis1
Introduction
A majority of drugs used today are taken orally, so the drugs must traverse several semipermeable cell membranes before reaching the systemic circulation[1]. These membranes are biological barriers that selectively inhibit the passage of drug molecules and are composed primarily of a bimolecular lipid matrix, containing mostly cholesterol and phospholipids. The lipids provide stability to the membrane and determine its permeability characteristics. Drugs can cross a biological barrier by passive diffusion, facilitate passive diffusion, active transport, and pinocytosis, but passive diffusion is the most common method[1]. In the small intestine, in which the major part of oral drug absorption occurs, the barrier to drug absorption is a membrane comprising intestinal columnar epithelial cells. For any novel drug that is developed, it is necessary to examine how it is absorbed in the small intestine. In the absorption process, transport across a cell membrane depends on the concentration gradient of the solute. Most drug molecules are transported across a membrane by simple diffusion from a region of high concentration (eg gastrointestinal fluids) to one of low concentration (eg blood)[2]. Because drug molecules are rapidly removed by the systemic circulation and distributed into a large volume of body fluids and tissues, drug concentration in the blood is initially low compared with that at the administration site, producing a large gradient. The diffusion rate is directly proportional to the gradient, but also depends on the molecule’s lipid solubility, degree of ionization, and the size and the area of the absorptive surface[3]; that is, the diffusion rate depends on the characteristics and area of the intestinal membrane and the drug’s properties, as well as the drug concentration gradient on both sides of the membrane.
Given the limitations of biomembranes, artificial membranes are usually used instead of biomembranes to study the absorption of drugs in the intestine. In vitro studies show that artificial membranes have some properties that are similar to those of biomembranes in vivo; that is, artificial membranes can be good mimics of biomembranes[3–5]. The Caco-2 cell monolayer is commonly used as an artificial membrane. When cultured on semipermeable membranes, Caco-2 cells, which are derived from a human colon adenocarcinoma, differentiate into a highly functionalized epithelial barrier with remarkable morphological and biochemical similarity to small intestinal columnar epithelium. The Papp values obtained from Caco-2 transport studies have been proven to correlate with those of human intestinal absorption, and the Caco-2 monolayer model has been proven to be extremely useful as a tool for mechanistic studies of drug absorption[3]. However, although the Caco-2 model is well characterized and has been proven to be useful, assays using the system are not perfect. The system requires a 3-week growth period and regular maintenance feeding, so it remains a relatively low throughput method. Irvine and co-workers tried another system using Madin-Darby canine kidney (MDCK) cells and found that it was possibly a useful tool for testing rapid membrane permeability[3]. MDCK cells are commonly used for studying cell growth regulation, metabolism, and transport mechanisms in distal renal epithelia. They can also differentiate into columnar epithelia and form tight junctions when cultured on semipermeable membranes. Irvine and co-workers studied a large number of compounds using both MDCK and Caco-2 assays to evaluate the suitability of MDCK cells as a possible tool for assessing membrane permeability and found that they were well suited. Others have also pointed out that MDCK cells are good candidates for modeling simple epithelia[6].
Based on the study carried out by Irvine and coworkers, we built membrane-interaction quantitative structure-activity relationship analysis (MI-QSAR) models to predict drug permeability through MDCK cells. The QSAR approach involves statistical analysis of various molecular descriptors for a series of biologically active molecules. The result of a QSAR study provides useful clues regarding the type of substituents that should be tested to improve the activity further. QSAR can play a vital role in lead exploitation. One successful example is the transformation of nalidixic acid with the help of QSAR into an important family of drugs: the quinolone carboxylates[7]. Since the method was established in the 1960s, QSAR equations have been used to describe the biological activities of thousands of different drugs and drug candidates[8,9]. Some new approaches have been used in QSAR since its initial development, for example, principal component analysis (PCA), partial least squares (PLS), artificial neural network (ANN)[10]. MI-QSAR is an advanced form of QSAR, in which membrane-interaction properties are added to the descriptor pool. MI-QSAR models predicting drug permeability through Caco-2 cells have been built by Kulkarni and co-workers[11]. In the present study, we built MDCK cell models for MI-QSAR analysis.
Materials and methods
MDCK cell permeation coefficients The dependent variable used in MI-QSAR analysis is the MDCK cell permeability coefficient, Papp. Irvine and co-workers performed permeability experiments on a data set of 55 structurally and chemically diverse drugs ranging in molecular weight from 130 to 470 and varying in net charge at pH 7.4[3]. MDCK cells were obtained from the American Type Culture Collection (ATCC; Rockville, MD, USA). MDCK cells were maintained in minimal essential medium containing 10% fetal bovine serum and fresh L-glutamine 2 mmol/L. Culture inserts were preincubated with culture medium at 37 °C for 1 h and then seeded with 6.64×10⁵ cells per cm2. MDCK monolayers were washed and fed with fresh medium 1 h post-seeding and again 24 h post- seeding. After 3 d of culturing, MDCK monolayers could be used to test the permeability of compounds. All compounds were tested in 6 replicate monolayers. Monolayers were incubated with donor and acceptor solutions for 60 min at 37 °C, 95% humidity, with 30 r/min reciprocal shaking[3,12]. The permeability coefficient was calculated according to the following equation[3]:
In this equation dQ/dt is the permeability rate, C0 is the initial concentration in the donor compartment, and A is the surface area of the filter.
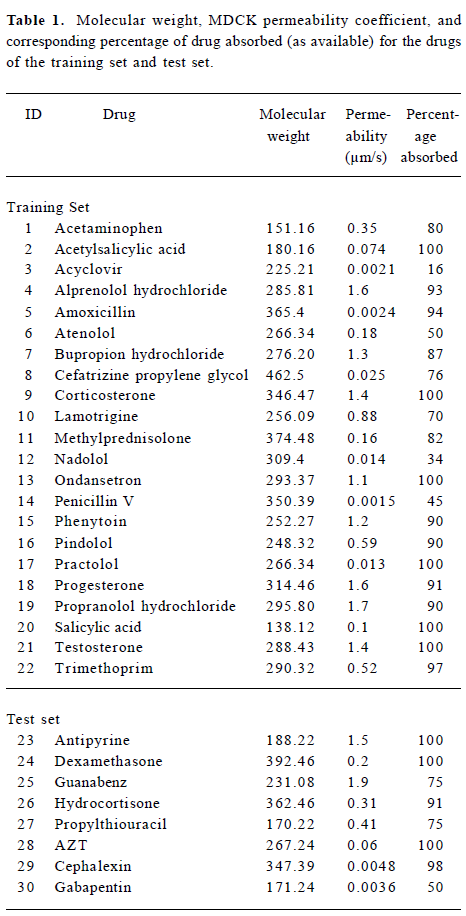
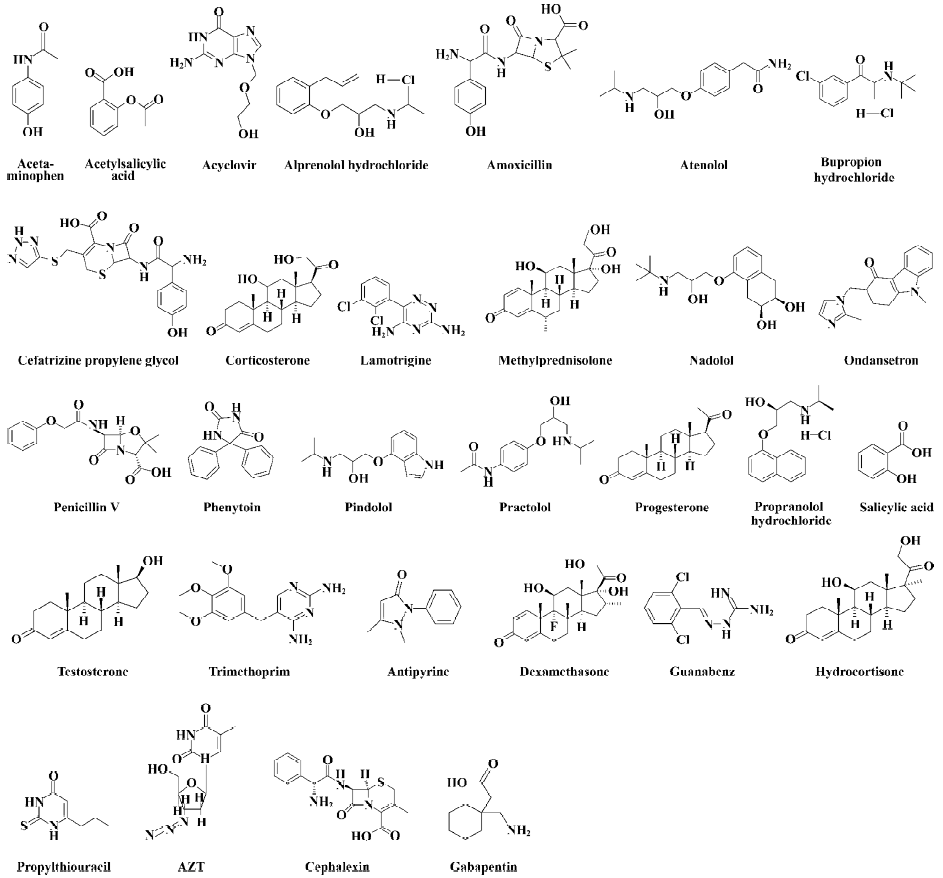
Table 1 contains the Papp values for 22 structurally diverse drugs used as a training set of compounds and 8 drug compounds as a test set. The 22 training set compounds and 8 test compounds were selected according to the criterion that members of the test set were to be representative of all members of the training set in terms of the range of Papp values, molecular weights, and structural and chemical diversities, to achieve a composite representative subset. Table 1 also contains a composite summary of the human percentage absorption values of many of the drugs in the table. These data were obtained from published values. Compared with the Papp value and the human percentage absorption value, it is obvious that the Papp values are indicative of in vivo drug uptake. Figure 1 shows the structures of these thirty molecules.
Full table
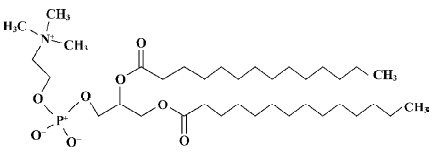
Building solute molecules and a dimyristoyl-phosphatidyl-choline (DMPC) monolayer All the solute molecules of the training set and test set were built using HyperChem software[13]. A single DMPC molecule was built using HyperChem from the published crystal structure data[14]. The DMPC molecule was selected as the model phospholipid in this study. The structure of the DMPC molecule is shown in Figure 2. An assembly of 25 DMPC molecules, 5×5×1 in x, y, and z directions, respectively, was used as the model membrane monolayer. The size of the monolayer simulation system was selected based on the work done by van der Ploeg and Berendsen[15]. These workers built 2 decanoate bilayers, with 2×8×2 and 2×16×2 phospholipid molecules, respectively, and performed a molecular dynamic simulation for each of them. It was found that the estimated order parameters for these 2 model bilayers agreed with one another, which suggests that the smaller assembly is adequate for modeling short-range properties. Other researchers have obtained similar geometric and energetic equilibrium property values with regard to the size of the simulation system that permits a minimum effective size (phospholipids) of the monolayer to be defined[16].
To prevent unfavorable van der Waals’ interactions between solute molecules and the membrane DMPC molecules, the single DMPC molecule in the center of the monolayer, which was located at position x, y=3,3 of the 5×5 DMPC monolayer model, was taken out[11], creating a space for the test solute molecules to insert into. Each of the test solute molecules of the permeation data set was inserted at 3 different positions or depths in the DMPC monolayer, with the most polar group of the solute facing toward the head group region of the monolayer. Three corresponding MDS(molecular dynamic simulation) models were generated for each solute molecule with regard to the trial positions of the solute molecules in the monolayer. The 3 trial positions were as follows[4,5,17]: solute molecule in the head group region, solute molecule between the head group region and the aliphatic chains, and solute molecule in the tail region of the aliphatic chains.
The energetically favorable geometry of the solute molecule in the monolayer was sought after using each of these trial positions. The 3 different positions of AZT, one of the training set solute molecules, are shown in Figure 3A to illustrate this modeling procedure. The most energetically favorable geometry of this solute molecule in the model DMPC monolayer is shown in Figure 3B.
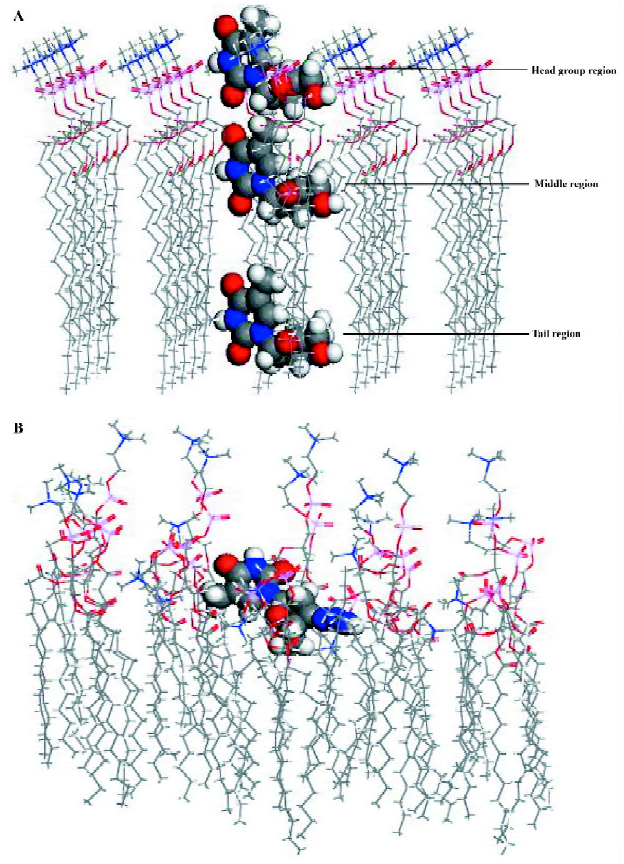
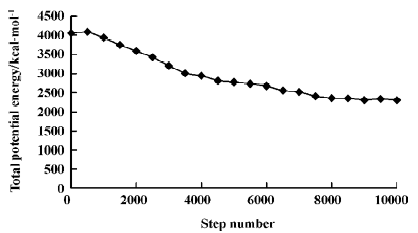
Molecular dynamic simulations MDS were carried out using the Discover module in Material Studio[18] with compass force field and NVT ensemble(an ensemble in which the dynamics are modified to allow the system to exchange heat with the environment at a controlled temperature). The selection of the simulation temperature was based on the phase transition temperature for DMPC, which was 297 K[11]. A simulation temperature of 311 K was selected because it is body temperature, and it is also above the DMPC phase transition temperature. Temperature was held constant in the MDS by coupling the system to an external fixed temperature bath. The trajectory step size was 0.001 ps over a total simulation time of 10 ps for each solute of the training set and test set. After 10 ps of simulation, molecule-membrane interactions arrived at an energetically stable phase(Figure 4). Two-dimensional periodic boundary conditions were used (a=32 Å, b=32 Å, c=80 Å, and γ=96.0º) for the DMPC molecules of the monolayer model, but not the test solute molecule. Only a single solute molecule was explicitly considered in each MDS. The angle γ is the angle that an extended DMPC molecule makes with the “planar surface” of the monolayer. Each of the solute molecules was placed at each of the 3 different positions in the monolayer, as described earlier, with the most polar portion of the solute “facing” toward the head group region. A snapshot of molecule AZT and the membrane around it was taken after MDS, as shown in Figure 3b.
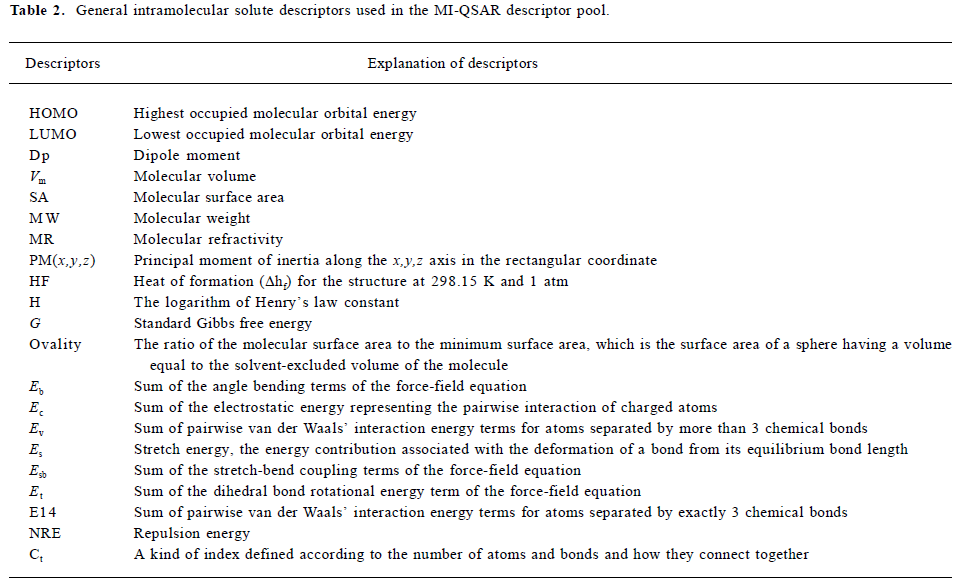
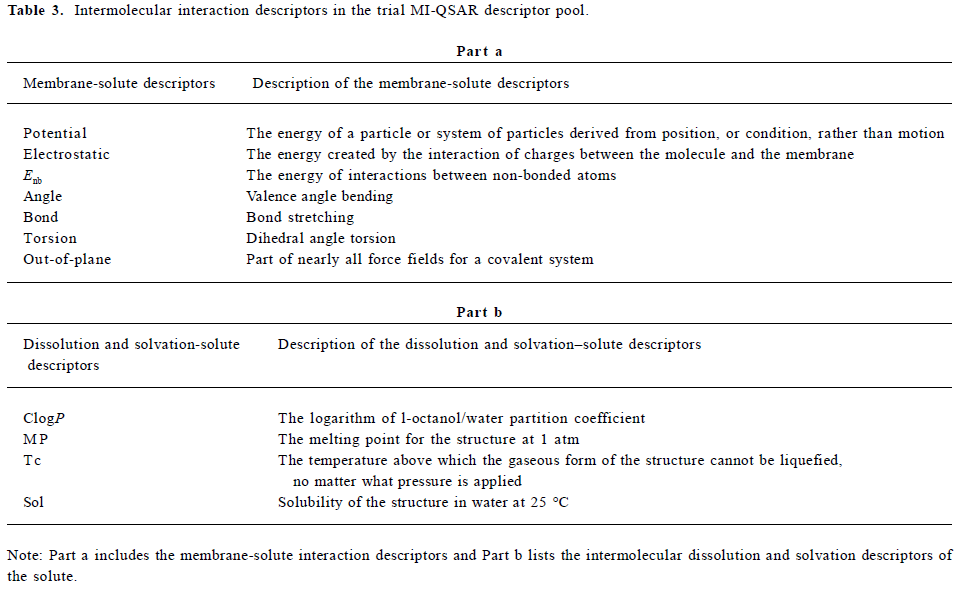
Calculation of descriptors Both intramolecular physicochemical properties and features of the solute molecules and intermolecular solute-membrane interaction properties were calculated. These properties and features will both be referred to as descriptors from this point forward because they constitute the trial pool of independent variables used to build the QSAR models. The descriptors used in the MI-QSAR analysis can also be divided into the following 3 kinds: 1) solute aqueous dissolution and solvation descriptors; 2) solute-membrane interaction descriptors; and 3) general intramolecular solute descriptors. Table 2 and Table 3 reporting the trial pool of descriptors used in the MDCK cell permeation MI-QSAR modeling use both classifications of the descriptors.
Full table
Full table
The general intramolecular solute descriptors included as part of the trial descriptor pool are defined in Table 2. The term “general” is used because solute descriptors in this class may be useful in describing different aspects of the bioavailability (in this case the MDCK cell permeation process) of a solute. There are other intermolecular properties computed using intramolecular computational methods, which are not included in Table 2, for example ClogP (the logarithm of 1-octanol/water partition coefficient), MP (melting point), Tc (critical tempeture), Sol (water solubility). All of these descriptors are intermolecular properties. They are classified as solvation and dissolution intermolecular descriptors and are reported in Table 3b. In Table 3a, there are solute-membrane interaction descriptors extracted directly from the MDS trajectories. These intermolecular descriptors were calculated using the most stable (lowest total potential energy) solute-membrane geometry from the 3 positions sampled for each of the solutes. For example, Figure 3b shows the lowest potential energy state of AZT in the membrane monolayer, which was used to estimate the solute-membrane interaction descriptors. Other solute-membrane interaction descriptors used in the QSAR descriptor trial set were determined using data from the MDS trajectories.
Construction and testing of MI-QSAR models Independent and useful descriptors can be extracted from all descriptors calculated earlier. The methods in common use are forward regression, backward regression and stepwise regression. Stepwise regression is the method used most frequently. The resulting regression equation from the stepwise regression method is not the best, rather it is an optimized result. SPSS was used to obtain the regression equation; it selected proper variables according to the partial sum of squares of regression in every step. The partial sum of squares for regression means that the sum of squares for regression increased or decreased after one variable was added to or deducted from the present regression equation. A parameter, F, is defined to check whether to introduce a variable or reject it when partial sum of squares for regression is of some value.
The stepwise regression method was used in this study, which was the combination of forward regression and backward regression methods. The single worst variable was picked out after each new variable was added. Two threshold constants, Fentry and Fremoval (Fentry<Fremoval), were given before the regression. If the F value of one variable, which had the largest partial sum of squares for regression of all the variables not included in the regression equation, was larger than or equal to Fentry, the variable could be introduced into the equation. Conversely, if the F value of one variable, which had the smallest partial sum of squares for regression among all the variables included in the regression equation, was less than or equal to Fremoval, the variable should be removed from the regression equation. These steps were carried out alternately until there was no variable to be introduced into the regression equation and none to be removed from it. The adjustment of the threshold values Fentry and Fremoval could affect the result of the selection of variables. If the prepared variables were few, it was appropriate to increase Fentry in order to introduce variables to the regression equation as much as possible. If the prepared variables were too many, Fremoval could be decreased to cut down the number of variables introduced into the regression equation.
SPSS was used to carry out the regressions and construct the models[19].
Results and Discussion
The best MI-QSAR models for MDCK cell permeability were realized by considering the combination of general intramolecular solute, intermolecular dissolution/solvation solute, and intermolecular membrane-solute descriptors presented as a function of the number of terms, that is, descriptors, included in a given MI-QSAR model:
Papp=115.657+319.687ClogP
n=22 R2=0.646 S=0.396 (2)
Papp=3113.84+374.691Clog P+338.881EHOMO
n=22 R2=0.719 S=0.362 (3)
Papp=3115.743+399.894Clog P+374.586EHOMO +35.07Es
n=22 R2=0.764 S=0.341 (4)
Papp=3453.482+409.333Clog P+391.596EHOMO +48.403Es–0.0971PMY
n=22 R2=0.813 S=0.312 (5)
Papp=3609.933+387.817ClogP+356.922EHOMO+32.256Es–0.163PMY –16594Ct
n=22 R2=0.866 S=0.272 (6)
Papp=1029.094+398.972Clog P+459.781EHOMO+24.048Es–0.174PMY–18164.4Ct +2.594Enb
n=22 R2=0.896 S=0.248 (7)
where n is the number of compounds, R2 is the coefficient of determination, and S is the standard error of the estimate (and its value could be different if the unit of the variables changed). The descriptors found in the best MI-QSAR models are as follows: 1) Clog P is the logarithm of the l-octanol/water partition coefficient; 2) EHOMO is the highest occupied molecular orbital energy; 3) Es is stretch energy, the energy contribution associated with the deformation of a bond from its equilibrium bond length; 4) PMY is principal moment of inertia Y, the inertia along the y axis in the rectangular coordinates; 5) Ct is total connectivity, which is a kind of index defined according to the number of atoms and bonds and their connecting sequence (Ct is a structural parameter; molecules with different structures have different connectivity indices according to a given definition); and 6) Enb is the energy of interactions between all of the non-bonded atoms.
The values of the 6 descriptors found in the 1–6 term MI-QSAR models for each compound in the training set and test set are given in Table 4.
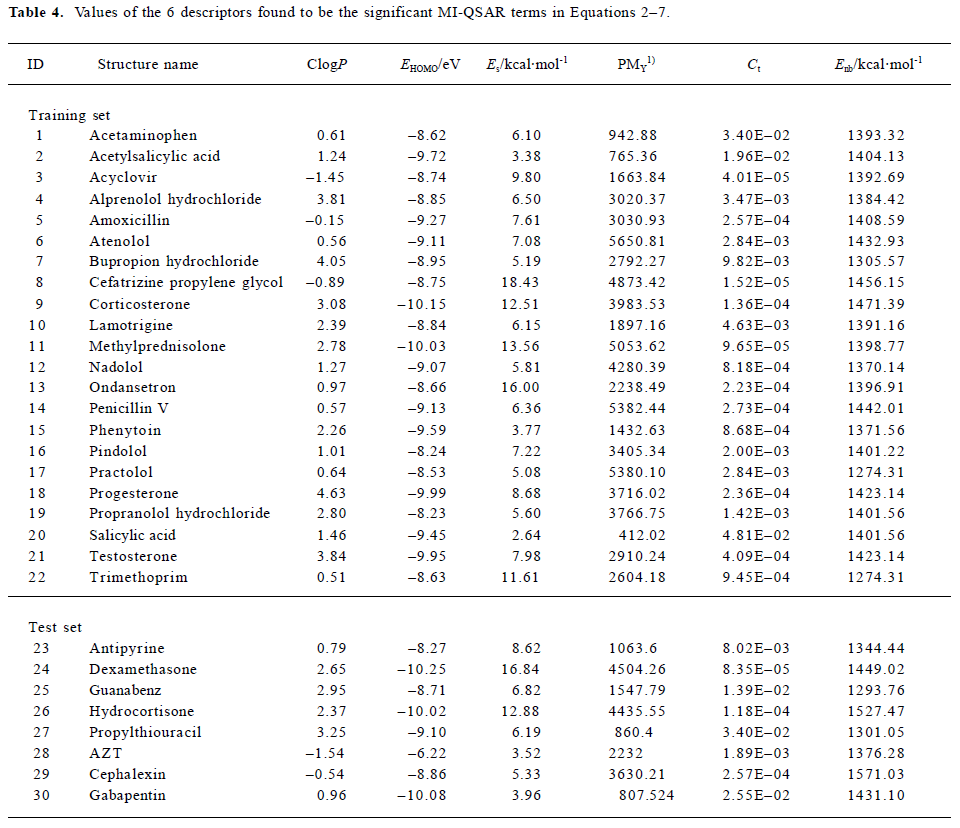
Full table
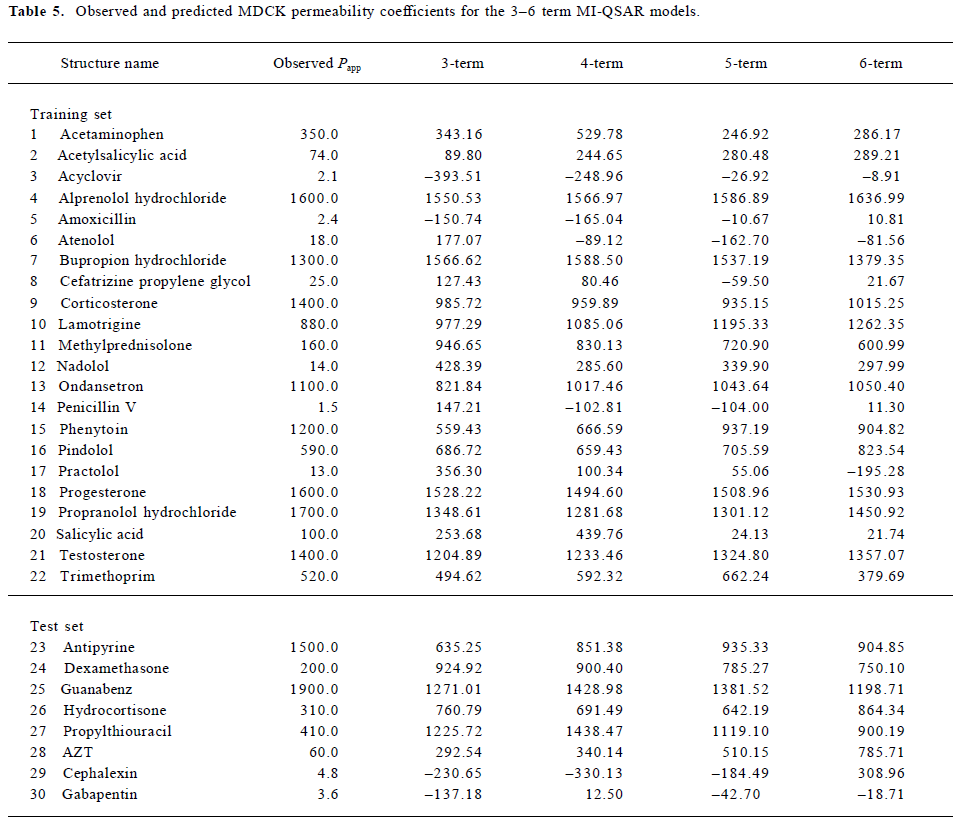
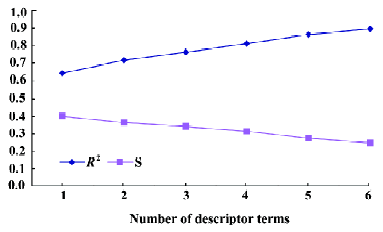
The observed and predicted (using the 3–6 term MI-QSAR models) MDCK cell permeation coefficients of the training and test set compounds are listed in Table 5 and plotted in Figure 5. Corticosterone, ondansetron, phenytoin, progesterone, propranolol hydrochloride, and testosterone are observed to permeate better than predicted by each of the MI-QSAR models, whereas acetylsalicylic acid, bupropion hydrochloride, methylprednisolone, and nadolol have a lower permeation coefficient than the one predicted by any of the models. Nevertheless, none of the compounds in either the training or test sets are outliers for the 3–6 term MI-QSAR models. Figure 6 contains plots of R2 and S for the training set. R2 increases with increasing numbers of descriptor terms, whereas the value of S decreases when the number of descriptor terms increases.
Full table

Analyzing Equations 2−7, it appears that ClogP in the 1-term model accounts for much of the variance of Papp across the training set. Both principal moment of inertia Y and total connectivity have a negative effect on the permeation coefficient. In 1-term to 5-term models, the descriptors are all intramolecular descriptors, but in the 6-term model, one membrane-solute interaction descriptor, Enb, is added in.
Eight compounds from the parent MDCK cell permeation coefficient data were selected to construct a test set to validate the MI-QSAR models. The molecules of the test set were selected so as to span the entire range of MDCK cell permeability for the composite training set. At the bottom of Table 5 are the observed and predicted Papp values for this test set. Figure 5 plots the test set as the last 8 compounds. There are no outliers, but antipyrine and guanabenz, compounds 1 and 3 of the test set, are predicted to have lower permeability coefficients than observed. Conversely, dexamethasone, hydrocortisone, propylthiouracil and AZT have higher predicted Papp values in all the models than the observed value.
The most important descriptor in the models is ClogP. ClogP is the computed logarithm of the l-octanol/water partition coefficient, and it has been ubiquitously used as a quantitative measure of hydrophobicity/lipophilicity since the 1960s[20,21]. A high ClogP value of a molecule implies that the molecule dissolves easily in hydrophobic materials and dissolves poorly in water. In the MI-QSAR models we built, ClogP had a positive effect on Papp, which implies that chemicals with high lipophilicity have better permeability through membranes than hydrophilic structures. It is easy to see why this is the case, because biomembranes are mainly composed of double phospholipid layers, so small hydrophobic molecules can pass through the layer with little obstruction. Commonly, lipophilic drugs permeate the small intestinal columnar epithelium quicker and easier than hydrophilic drugs.
In Equation 3, another descriptor, EHOMO appears, which represents HOMO energy. HOMO energy is the energy of the highest occupied molecular orbit, which is the opposite of LUMO energy, the energy of the lowest unoccupied molecular orbit[22]. The greater EHOMO is, the greater the electron-donating capability; conversely, the smaller ELUMO is, the smaller the resistance to accept electrons. Compounds that present larger values of EHOMO are more electron donor and the compounds that present smaller values of ELUMO are more electron acceptor. These variables are interpreted as measures of molecular reactivity and stability. As EHOMO increases (relative to other molecules), the molecule is less stable and more reactive. For ELUMO, the situation is the opposite. HOMO energy is relevant because Equation 3 measures the electron-donating character of the drug molecules. Papp has a positive relationship with HOMO energy, which means that drug molecules with higher electron-donating capacities can permeate membranes better.
As seen in the literature, energy is often discussed in many research programs. There is another energy descriptor, stretch energy, which influences Papp as EHOMO does in our models. Stretch energy is the energy contribution associated with the deformation of a bond from its equilibrium bond length. It is a kind of vibration energy, which is composed of bend energy and stretch energy. From Models 3–6, we can see that stretch energy is positively correlated with the value of Papp. Increasingly positive stretch energy values correspond to increasing Papp. Drug molecules with higher stretch energies metamorphose better and can permeate membranes more easily.
PMY is the principal moment of inertia along the y axis. It gives information about how the product of force and distance influence the value of Papp. Papp decreases as the value of PMY increases. The coefficients of PMY in Models 4–6 are very small when contrasted with the coefficients of other variables. This indicates that a change in PMY value has comparatively little effect on the value of Papp and the permeability of the drug molecules.
Compared with the descriptors discussed earlier, connectivity is an element that rarely appeared in QSAR models constructed by other researchers. Connectivity is a parameter defined according to the conformation of a molecule, and presumes that there is some functional relationship between molecule properties and connectivity. One standard definition of connectivity is as follows[23,24]:
Figure 7 is the structure of isopentanol without hydrogens. The figures are the bond numbers of each carbon connected with other carbons.
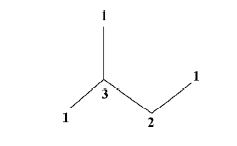
From the foregoing equation, we can see that connectivity reflects the connection and ramification conditions of the molecules. Connectivity is the quantitative description of the molecular structure. Molecules with different structures have different connectivity values. The connectivity method has been widely used in structure-activity analyses. In the models we constructed, connectivity is included in Model 5 and Model 6 and it has a negative effect on the Papp value. The larger the connectivity value, the more complicated the structure will be, and there will be more branch chains. Therefore an increase in connectivity will decrease the permeability of a molecule.
Enb is the energy of interactions between non-bonded atoms. It includes van der Waals’ energy, electrostatic energy and hydrogen bond terms in some older forcefields, as the following equation describes[25],
Enon-bond=EvdW+Ecoulomb+Ehbond (8)
The non-bond energy terms in Equations 6 and 7 suggest that permeability increases with increasing binding of the solute to the phospholipid regions of the membranes.
Kulkarni and coworkers carried out MI-QSAR analysis using the permeability coefficients of some drug molecules tested by Caco-2 cells. Thirty molecules were included in their training set, and significant MI-QSAR models were built. Twenty-three intramolecular descriptors, and 11 membrane-solute interaction descriptors were calculated. In our study, we calculated more than 70 descriptors for every drug molecule in the training set, including electronic, steric, and thermodynamic properties. MI-QSAR models were built based on the analysis of these descriptors. In addition, the present study confirmed the conclusion of Irvine and coworkers, that MDCK cells are suitable for studying drug permeability through biomembranes.
Acknowledgements
We are very grateful to the administrators in the Computer Laboratory of College of life, Nanjing University, for their support in carrying out this study.
References
- Moo JC, David PT, Clay TC, Thomas JV, Jeffrey FS. The Madin Darby Canine Kidney (MDCK) epithelial cell monolayer as a model cellular transport barrier. Pharm Res 1989;6:71-7.
- Magali T, Peter R, Daniel HS. Pharmacology. Churehill Livingstone: Harcourt Asia; 1998.
- Irvine JD, Takahashi L, Lockhart K, Cheong J, Tolan JW, Selick HE, et al. MDCK (Madin-Darby Canine Kidney) cells: a tool for membrane permeability screening. J Pharm Sci 1999;88:28-33.
- Kulkarni A, Hopfinger AJ, Osbrone R, Bruner LH, Thompson ED. Prediction of eye irritation from organic chemicals using membrane-interaction QSAR analysis. Toxicol Sci 2001;59:335-45.
- Kulkarni A, Hopfinger AJ. Membrane-interaction QSAR analysis: application to the estimation of eye irritation by organic compounds. Pharm Res 1999;16:1244-52.
- Rothen-Rutishauser B, Kraemer SD, Braun A, Guenthert M, Wunderli-Allenspach H. MDCK cell cultures as an epithelial in vitro model: cytoskeleton and tight junctions as indicators for the definition of age-related stages by confocal microscopy. Pharm Res 1998;15:964-71.
- Alka K. C-QSAR: a database of 18000 QSARs and associated biological and physical data. J Comput Aided Mol Des 2003;17:187-96.
- Hugo K. QSAR and 3D-QSAR in drug design. Part 1: methodology. Drug Discov Today 1997;2:457-67.
- Hugo K. QSAR and 3D-QSAR in drug design. Part 2: applications and problems. Drug Discov Today 1997;2:538-46.
- Lennart E, Erik J. Multivariate design and modeling in QSAR. Chemometrics Intell Lab Syst 1996;34:1-19.
- Kulkarni A, Han Y, Hopfinger AJ. Predicting Caco-2 cell permeation coefficients of organic molecules using membrane-interaction QSAR analysis. J Chem Inf Comput Sci 2002;42:331-42.
- Braun A, Hammerle S, Suda K, Rothen-Rutishauser B, Gunthert M, Kramer SD, et al. Cell cultures as tools in biopharmacy. Eur J Pharm Sci 2000;11 Suppl 2:S51-60.
- HyperChem. HyperChem, Release 6.0 for MS Windows. Waterloo (Ontario, Canada): Hypercube; 2001.
- Hauser H, Pascher I, Pearson RH, Sundell S. Preferred conformation and molecular packing of phosphatidylethanolamine and phosphatidylcholine. Biochim Biophys Acta 1981;650:21-51.
- van der Ploeg P, Berendsen HJC. Molecular dynamic simulation of a bilayer membrane. J Chem Phys 1982;76:3271-6.
- Stouch TR. Lipid membrane structure and dynamics studied by all atom molecular dynamics simulations of hydrated phosphatidylcholine vesicles. Mol Simulation 1993;1:335-62.
- Gurtovenko AA, Patra M, Karttunen M, Vattulainen I. Cationic DMPC/DMTAP lipid bilayers: molecular dynamics study. Biophys J 2004;86:3461-72.
- Accelrys: Materials Studios. San Diego (USA): Accelrys; 2001.
- SPSS. SPSS for Windows. Chicago (USA): SPSS Inc; 2001.
- Butina D, Segall MD, Frankcombe K. Predicting ADME properties in silico: methods and models. Drug Discov Today 2002;7 Suppl 11:S83-8.
- Albert PL. Screening for human ADME/Tox drug properties in drug discovery. Drug Discov Today 2001;6:357-66.
- Honorio KM, Da Siliva ABF. An AM1 study on the electron-donating and electron-accepting character of biomolecules. Int J Quant Chem 2003;95:126-32.
- Kier LB, Hall LH. Molecular connectivity in chemistry and drug research. New York: Academic Press; 1976.
- Kier LB, Hall LH. Molecular connectivity in structure-activity analysis. London: John Wiley; 1986.
- Iyer M, Mishra R, Han Y, Hopfinger AJ. Predicting blood-brain barrier partitioning of organic molecules using membrane-interaction QSAR analysis. Pharm Res 2002;19:1611-21.
- Deretey E, Feher M, Schmidt JM. Rapid prediction of human intestinal absorption. Quant Struct-Act Relat 2002;21:493-506.
- Levet-Trafit B, Gruyer MS, Marjanovic M, Chou RC. Estimation of oral drug absorption in man based on intestine permeability in rats. Life Sci 1996;58:359-63.
- Zhao YH, Abraham MH, Hersey A, Luscombe CN. Quantitative relationship between rat intestinal absorption and Abraham descriptors. Eur J Med Chem 2003;38:939-47.
- Peter B. Modeling liquid properties, solvation, and hydrophobi-city: A molecular size-based perspective. Perspect Drug Discov Des 2000;19:19-45.