Astragalus polysaccharide reduces hepatic endoplasmic reticulum stress and restores glucose homeostasis in a diabetic KKAy mouse model1
Introduction
Type 2 diabetes mellitus (T2DM) is one of the toughest cases of human diseases worldwide. The number of T2DM patients is expected to affect 300 million people by the year 2025[1] due to an increased number of elderly people, a greater prevalence of obesity, and sedentary lifestyles. Therefore, it is very important to reinforce the effective prevention and cure of this disease. Traditional Chinese medicines and their extractions demonstrate the characteristics of economy and effectiveness to cure diabetes and its complications. In traditional Chinese medicine, Astragalus is commonly found in mixtures with other herbs, and is used in the treatment of numerous ailments, including heart, liver, and kidney diseases, as well as cancer, viral infections, and immune system disorders. Western herbalists began using Astragalus in the 1800s as an ingredient in various tonics. The use of Astragalus became popular in the 1980s based on theories about anticancer properties, although these proposed effects have not been clearly demonstrated in reliable human studies. Astragalus polysaccharides (APS), the polysaccharide component of the ethanol extract of Astragalus roots is an important active component of Astragalus. Apart from the actions of the antioxidant, antihypertensive, and immunomodulatory activities[2–4] of APS, we found that it also shows insulin-sensitizing and hypoglycemic activity by decreasing the elevated expression and activity of protein-tyrosine phosphatase 1B (PTP1B) in the skeletal muscles of T2DM rats in our previous research[5].
Among the 3 major insulin-responsive tissues (fat, muscle, and liver), liver plays a central role in the control of glucose homeostasis and is subject to complex regulation by insulin and other hormones[6]. Many studies have proved that the impaired regulation of hepatic glucose production is a characteristic feature of the metabolic syndrome, which is also known as “insulin resistance syndrome”[7]. It has recently been discovered that endoplasmic reticulum (ER) stress maybe a key link between obesity, insulin resistance, and T2DM[8]. Hepatocytes have a well-developed ER structure and ER stress is involved in the development of hepatic insulin resistance[9]. In light of the important role of the liver in glucose homeostasis and the pathogenesis of diabetes, we sought to examine the potential effect of APS on the insulin signal and ER stress response signal in hepatocytes of diabetic animals and a high glucose-treated cell model.
In this study, we provide evidence that the mechanistic link mentioned earlier can be exploited for therapeutic purposes with the traditional oral Chinese herb APS, which alleviates ER stress in high glucose-treated HepG2 cells and a diabetic animal model. The treatment of obese and diabetic KKAy mice, which is the yellow offspring of the KK mice, expressed Ay gene, with APS resulted in the normalization of hyperglycemia, restoration of systemic insulin sensitivity, resolution of fatty liver disease, and the enhancement of insulin action in the liver. Our results demonstrated that APS can improve insulin sensitivity coupled with the enhanced adaptive capacity of the ER and acts as potent antidiabetic modalities with potential application in the treatment of type 2 diabetes.
Materials and methods
Plant materials and preparation of APS Astragalus membranaceus (Fisch) and Bunge var mongholicus (Bunge) Hsiao were purchased from Shanghai Medicinal Materials (Shanghai, China) and identified by the Department of Authentication of Chinese Medicine, Hubei College of Chinese Traditional Medicine (Wuhan, China). We used the representative specimen which had been kept in our laboratory by anterior researchers. In brief, APS was extracted with optimized techniques using direct water decoction, as described previously[10]. Three subtypes of APS are defined by phytochemical screening: APSI, II, and III (1.47:1.21:1). APSI consists of d-glucose, d-galactose, and l-arabinose in molar ratios of 1.75:1.63:1 and has an average molecular weight of 36 300 kDa. Both APSII and APSIII are dextrans, the linkage mode of which is mainly α-(1>4) linkages, and in which α-(1>6) linkages are exiguous. APS is a hazel-colored and water-soluble powder. It was diluted to 12% in normal saline before use.
Biochemical reagents GAPDH (ab9845), glycogen synthase kinase 3 beta (GSK3β, 9332), p (ser9)-GSK3β (9336), and p (ser641)-GS (3891) were purchased from Abcam (Abcam, Cambridge, UK) and Cell Signaling Technology (Danvers, MA,USA). DMSO (D098-100) and tunicamycin (Tun, T-7765) were from Sigma (St Louis, MO, USA). Dulbecco’s modified Eagle’s medium (1×), liquid (no glucose) (11966025)without glucose and sodium pyruvate containing L-glutamine were from Invitrogen-Gibco (Frederick, MD, USA). Enhanced chemiluminescence (ECL) was performed by using the protein detector Lumi-GLO western blot kit from Kierkegaard and Perry Laboratories (Gaither-sburg, MA, USA). The BCA (bicincho-ninic acid) protein assay kit was from Pierce Biotechnology (Rockford, IL, USA). The RevertAid first strand cDNA synthesis kit (K1622) and reagents for PCR were from Fermentas (Glen Burnie, MD, USA). The EZNA gel extraction kit was from Omega (Peqlab, Erlangen, Germany). The DyNAmo SYBR green qPCR kit was from Finnzymes (Ipswich, MA, USA). All other chemicals and reagents were of analytical grade.
Mouse models and administration of APS Female KKAy and C57BL/6J mice from the age of 8 weeks were obtained from the Chinese Academy of Medical Sciences (Beijing, China) and housed individually in plastic cages at 20 oC, with lighting on from 6:00–18:00. The C57BL/6J mice were fed a normal chow diet consisting (as a percentage of total kcal) of 12% fat, 60% carbohydrates, and 28% protein. The KKAy mice were fed a high-fat diet consisting of 41% fat, 41% carbohydrates, and 18% protein. The KKAy mice were a cross between glucose-intolerant black KK female mice and male, yellow, obese Ay mice and are known to serve as excellent models of T2DM, while C57BL/6J mice with normal diets are generally used as non-diabetic controls[11–14]. All experimental procedures were approved and carried out in compliance with the guidelines of the Wuhan University School of Medicine Committee on Animals. From 12 weeks of age the animals were given APS (700 mg·kg-1·d-1) orally or vehicle treatment (PBS, phosphate-buffered saline) for 2 months at the same time. Plasma glucose, insulin, glycogen[15], free fatty acid (FFA), and triglyceride[16] were measured with commercial kits. Before necropsy, saline- and APS-treated animals were intraperitoneally administered insulin (10 U/kg body wt) in saline or vehicle (saline) after overnight fasting. After 10 min, the mice were killed and the liver was rapidly excised and snap frozen in liquid nitrogen.
Insulin sensitivity (oral glucose tolerance test and the homeostasis model assessment, HOMA-IR) Insulin sensitivity was identified by the comprehensive analysis of the oral glucose tolerance test (OGTT) and calculated HOMA-IR (HOMA-IR index=FPG(Fasting plasma glucose) [mmol/L]×FINS(fasting insulin) [µU/mL]/22.5)[17]. The OGTT was performed after a 16 h overnight fast. Glucose (2 g/kg) was administered orally and blood was collected from the orbital sinus at 0, 30, 60, and 120 min, respectively[18]. The area under the curve (AUC) was calculated for glucose during the OGTT (AUC=0.5× [Bg0+Bg30]/2+0.5× [Bg30+Bg60]/2+1× [Bg60+Bg120]/2).
Liver histology The liver samples were embedded in paraffin, and sections were cut into 6 mm slices. Neutral lipid was stained with Sudan III on frozen sections. The hepatocyte ultrastructure was presented by transmission electron microscope (TEM). The total operative procedures complied with the standard protocols.
Cell culture and pretreatment with APS The human hepatocarcinoma cell line HepG2 cells were cultured in minimal essential medium containing 10% fetal bovine serum and 0.5 mg/mL geneticin, supplemented with 100 U/mL penicillin, 100 µg/mL streptomycin, and 2 mmol/L l-glutamine in a humidified atmosphere with 5% CO2 at 37 oC. The cells were plated at a density of 3×10⁴ cells/cm2 and maintained in culture medium for 24 h before treatment. The HepG2 cells were grown on coverslips and treated with tunicamycin (Tm, 10 µg/mL)[19] for 16 h as positive ER stress cell control and treated with high glucose culture medium (30 and 45 mmol/L, respectively) for 5 h to induce ER stress response in vitro. The HepG2 cells were pretreated with APS (200 µg/mL) for 24 h.
Analysis of XBP1 (XhoI site-binding protein 1) mRNA transcription and splicing by real-time RT-PCR RNA was extracted from the liver samples and HepG2 cells using Trizol reagent. Gene transcription was analyzed by semiquantity RT–PCR and real-time PCR. The total RNA concentration and purity were determined by measuring the OD260 and OD260/OD280 ratio. The specific primers for the mouse and human samples are as follows: mXBP1 mRNA, sense: 5'-AAACAGAGTAGCAGCGCAGACTGC-3' and antisense: 5'-TCCTTCTGGGTAGACCTCTGGGAG-3'; mβ-actin mRNA, sense: 5'-TCATCACTATTGGCAACGAGC-3' and antisense: 5'-AACAGTCCGCCTAGAAGCAC-3'; hXBP1 mRNA, sense: 5'-AAACAGAGTAGCAGCTCAGACTGC-3' and antisense: 5'-TCCTTCTGGGTAGACCTCTGGGAG-3'; and hβ-actin mRNA, sense: 5'-CAGGGCGTGATGGTGGGCA-3' and anti-sense: 5'-CAAACATCATCTGGGTCATCTTCTC-3'. In brief, 1 µg total RNA was used to prepare cDNA. Real-time PCR reaction was performed by the following thermal cycling contidions: 94 oC for 4 min, 94 oC for 10 s, 65 oC for 30 s, repeated for 40 cycles, and 72 oC for 30 s. Digestion with PstI (which cuts only in the unspliced cDNA) was used to distinguish the unspliced from the spliced bands and then we ran a carefully prepared 2% gel that would present the 2 PCR products clearly. This protocol works for the human and mouse genes. The quantity of specific mRNA was normalized as a ratio to the amount of β-actin mRNA.
Analysis of protein expression and phosphorylation by Western blotting The cell lysates from tissues or cells were prepared in 1 mL lysis buffer (20 mmol/l Tris, pH 7.5, 5 mmol/L EDTA, 10 mmol/L Na4P2O7, 100 mmol/L NaF, 2 mmol/L Na3VO4, 1% Nonidet P-40, 1 mmol/L phenyl-methylsulfonyl fluoride, and 10 µg/mL aprotinin) on ice in 1.5 mL microtubes. The lysates were solubilized by continuous stirring for 1 h at 4 oC and centrifuged for 10–15 min at 14 000×g. The supernatants were collected and protein concentrations were measured with BCA protein assay reagent and then stored at -80 oC until further analysis. The cell lysates were subjected to SDS-PAGE and blotted onto a polyvinylidene difluoride membrane followed by incubation with the primary antibodies anti-GSK3β, anti-ser9GSK3β, and anti-ser641GS. The proteins were detected with an ECL system.
Statistical analysis All values are expressed as mean± SEM. Statistical significance was determined using ANOVA followed by Turkey’s test. P<0.05 was considered statistically significant.
Results
Effect of APS treatment on systematic glucose metabolism and insulin sensitivity in KKAy mice
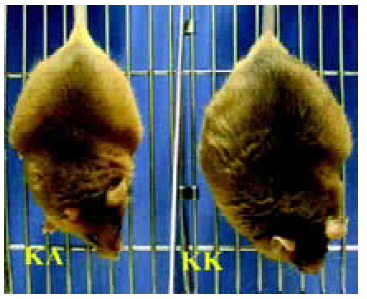
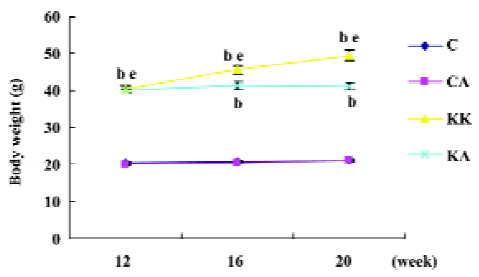
Characteristics of experimental animals To investigate the in vivo effects of APS, we employed obese and diabetic (KKAy) mice, a model of severe obesity and insulin resistance. The glucose levels of both fasting and fed mice were significantly upregulated in KKAy mice (T2DM) than those in normal C57BL/6J mice (control) (1.6-fold, P<0.05; 3.6-fold, P<0.05, respectively; Figure 1), which were significantly reduced after treatment with APS (700 mg·kg-1·d-1, po) for 8 weeks. Notably, the insulin concentrations in KKAy mice were higher than the values of the control mice (6-fold, P<0.05), but treatment with APS did not affect the insulin levels in both the control and type 2 diabetic mice, suggesting that the action of APS may not be mediated by changing the insulin levels. The KKAy diabetic mice weighed 20 g more than the normal chow-fed C57BL/6J mice (20.4±0.4 vs 40.3±0.6, P<0.05). APS treatment could significantly inhibit body weight gain in diabetic mice (KA: 41.0±0.9 vs KK: 45.6±1.4, P<0.05) and had no effect on that of the control mice (CA: 20.9±0.1; C: 21.1±0.1, P>0.05; Figures 2, 3). All data are expressed as mean±SEM calculated from the results of 8–10 mice
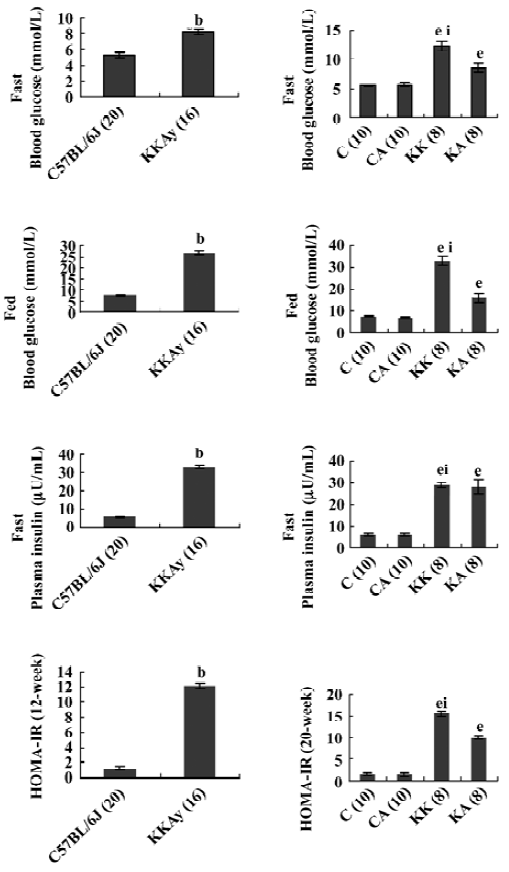
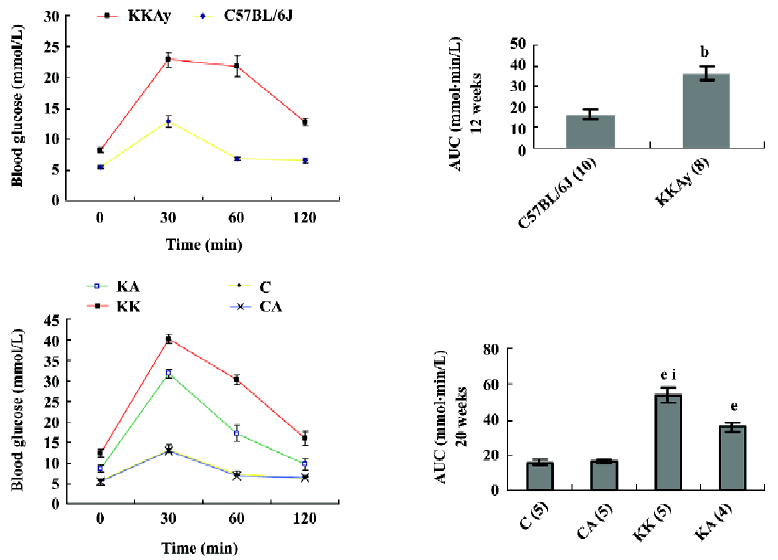
Insulin sensitivity The KKAy mice did not show significant reductions in insulin levels after APS treatment (KA mouse group; Figure 1). To confirm whether APS improved glucose intolerance in KKAy mice, we performed a OGTT and observed that the mice treated with APS showed a lower peak of plasma glucose concentration at 30 min after the glucose load. The plasma glucose level declined more rapidly compared with that in the vehicle-treated KKAy mice (Figure 4). Accordingly, after APS therapy, the HOMA-IR index in the KA mouse group was significantly lower than that in the KK mouse group (10.0±0.51 vs 15.5±0.52, P<0.05). These results suggest that the blood glucose-lowering effect of APS is due to increased systemic insulin sensitivity. In addition, neither of these parameters, blood glucose and insulin levels, were different the between APS-treated (C group mice) and vehicle-treated lean control C57BL/6J mice (CA group mice). Taken together, the impaired insulin sensitivity in the T2DM rats was improved following APS treat-ment.
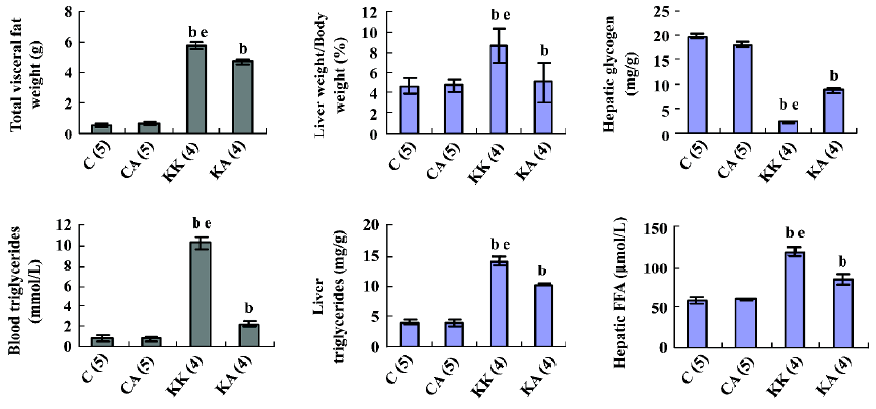
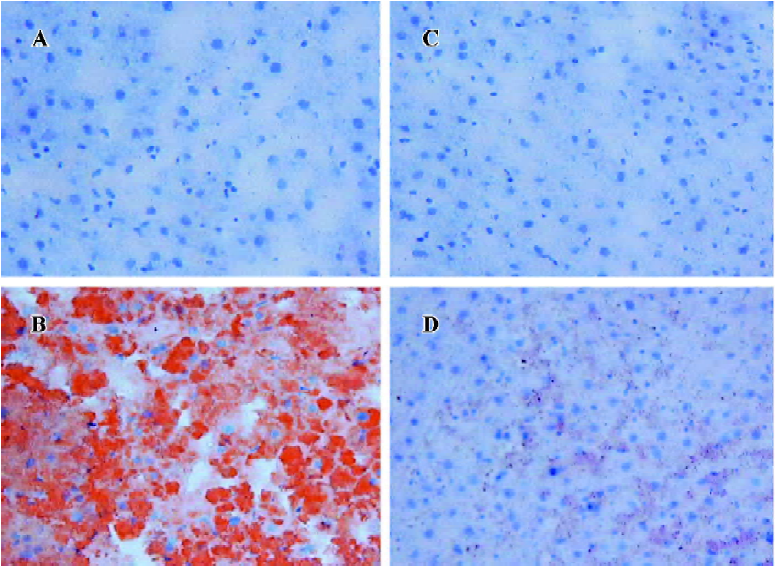
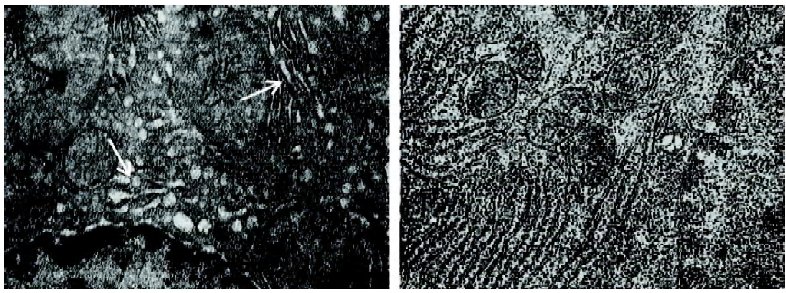
Liver pathology and biochemistry Obesity and diabetes in mice and humans is associated with alterations in liver lipid metabolism and fatty liver disease[19–21]. APS treatment resulted in the resolution of the obesity-induced lipid accumulation and glycogen synthesis in the liver from KKAy mice (Figure 5). There was a significant reduction in liver triglyceride and FFA content in the APS-treated KKAy mice compared to the control animals (P<0.05; Figure 5). Consistent with this, liver Sudan III staining also showed a significant alleviation of fatty degeneration in APS-treated KKAy mice (Figure 6). Additionally, the dilated ER of hepatocytes was observed by TEM, which can be ameliorated with APS therapy (Figure 7).
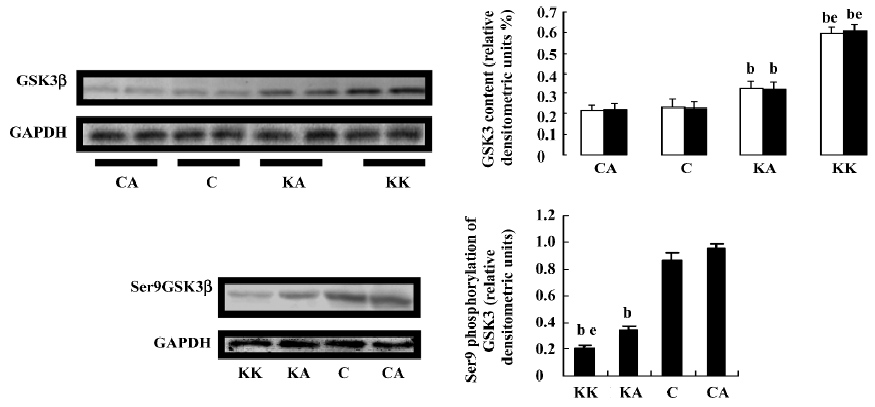
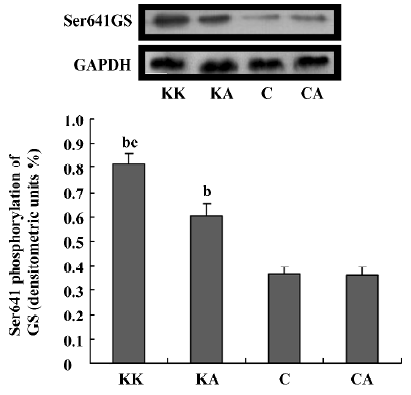
Effect of APS treatment on hepatic insulin signal transduction in KKAy mice In an attempt to understand the ameliorating effect of APS on insulin signal transduction in the liver tissue, we next examined whether APS affected the expression and activity of hepatic GSK3β in the obese and diabetic KKAy mouse model. APS treatment significantly reduced GSK3β protein levels in KKAy mice (P<0.05, Figure 8). Importantly, treatment with APS significantly induced GSK3β phosphorylation at serine 9, which is the inactivated form of this kinase (P<0.05, Figure 8). Hepatic glycogen synthase (GS), which is a key enzyme in the regulation of glycogen synthesis, is regulated by the phosphorylation of the sites between Ser641 and Ser653 targeted by GSK3[22]. To support this, GSK3 inhibitors stimulate hepatic glycogen synthase. Thus, we further examined the effect of APS on the insulin-induced Ser641 phosphorylation of GS. APS treatment significantly reduced GS phosphorylation at the Ser641 site (P<0.05, Figure 9). These results indicate that APS has a positive effect on hepatic insulin transduction.
Effect of APS treatment on markers of ER stress in KKAy mice As metabolic demands increase, for example, in the state of hyperglycemia, ER becomes over loaded, which can perturb the protein folding in this protein factory. The distressed ER may further contribute to impaired insulin action in obesity and ER stress leads to the development of insulin resistance and eventually type 2 diabetes[8]. To confirm whether APS can act as an agent to enhance the adaptive capacity of the ER, XBP1 transcription and splicing in the liver of the KK group mice was detected with a significant increase compared with the controls (P<0.05), indicating that high ER stress exists in this diabetic animal model (Figure 10). Notably, APS administration could reduce the level of XBP1 (P<0.05) in KKAy mice. Spliced XBP1 levels in the liver from the KK group were also significantly increased compared with those of the KA group (P<0.05). XBP1 transcription and splicing in the liver of normal control mice was not affected by APS treatment (Figure 10A, 10D).
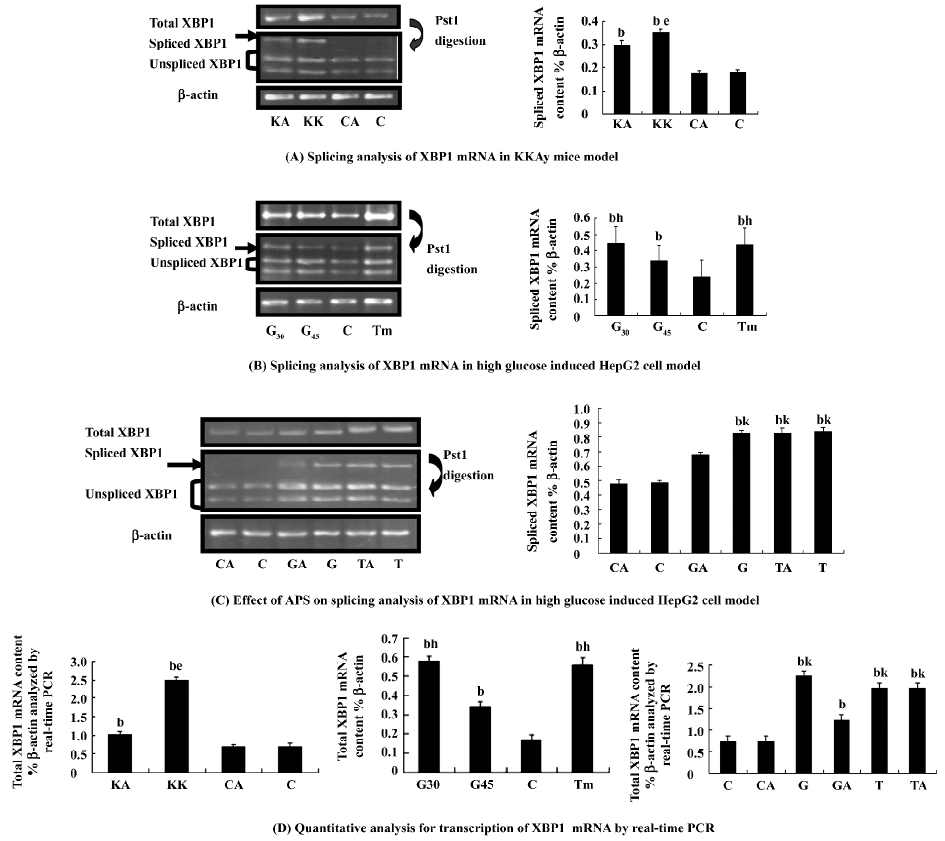
Effect of APS treatment on the high glucose-treated HepG2 cell model The transcription factor XBP1 is a basic motif-leucine zipper protein. The spliced or processed form of XBP1 (XBP1s) is a key factor in ER stress through the transcriptional regulation of an array of genes, including molecular chaperones[23–26]. The modulation of XBP1s in cells could alter insulin action via its potential impact on the magnitude of the ER stress responses[27]. Hyperglycemia is a direct cause of insulin resistance, which is the hallmark of T2DM. We next examined whether ER stress is increased in high glucose conditions and whether APS can perform this effect on ER stress in vitro by measuring XBP1 transcription and splicing in the high glucose-treated cell model. High glucose (30 mmol/L) is suitable to induce significant ER stress. We observed that APS inhibited high glucose-induced ER stress responses in cultured HepG2 cells (Figure 10), while it had no significant effect on Tm-induced ER stress. These may indicate that APS is not an antagonist of tunicamycin, and APS inhibition of ER stress is likely by modification of metabolic disturbance and maintaining glucose homeostasis.
Discussion
T2DM is one of the most prevalent and serious metabolic diseases in the world. Hyperglycemia can directly cause insulin resistance, which is associated with an imbalance between endocrine pancreatic function and hepatic and extrahepatic insulin sensitivity[28]. Among the 3 major insulin-responsive tissues (fat, muscle, and liver), the liver plays a central role in the control of glucose homeostasis; insulin signaling in liver is critical in maintaining normal hepatic function[6,7]. Many studies have proved that the impaired regulation of hepatic glucose production is a characteristic feature of the metabolic syndrome[29], which is also known as “insulin resistance syndrome”, including obesity, insulin resis-tance, type 2 diabetes, and other metabolic disorders[20].
The ER is a membranous network that provides a specialized environment for processing and folding newly synthesized proteins. As metabolic demands increase, which can perturb the protein folding in the ER, so does the work-load of this protein factory, collectively called ER stress[19]. Since hepatocytes have a well-developed ER structure, ER stress is involved in liver-related diseases[9]. Sustained ER stress, which appears to occur as a result of obesity and diabetes, modulates insulin action in the liver[8]. The development of hepatocellular ER stress as a result of diabetes/obesity appears to be a major contributor to insulin resistance[9]. Inhibiting ER stress in the liver or increasing hepatic sensitivity to insulin might break the vicious circle linking hyperinsulinemia and insulin resistance that leads to elevated triglyceride and FFA concentrations, progressive steatosis, ultrastructural mitochondrial lesions in the hepatocytes, and ultimately hepatocyte death. Therefore, we wonder whether the beneficial function of APS on the insulin signal pathway is associated with suppressing ER stress in the liver.
In this study, we adopted KKAy mice as a model of T2DM. KKAy mice show hyperglycemia, hyperlipidemia, and hyperinsulinemia compared with C57BL/6J mice. Consistent with our previous study[5], we prove that APS has significant hypoglycemic activity and insulin-sensitizing effects in the present study. The diabetic mouse model was significantly obesity-resistant and showed alleviated hepatic fatty degeneration in response to APS therapy. As the liver is the hinge of nutritive material metabolism, hepatic insulin resistance has been suggested to be a later factor in the development of hyperglycemia. Increased hepatic glucose production is tightly correlated with fasting hyperglycemia in type 2 diabetics[30]. The presence of fatty liver inT2DM and obese patients, which is also known as non-alcohol fatty liver, has long been reported. Obesity-related insulin resistance might be partly responsible for liver fat deposition[21], so it is important for us to detect whether APS can ameliorate hepatic insulin sensitivity and its mechanism.
To further analyze the action of APS on hepatic glucose metabolism and insulin action, we observed the expression and activity of hepatic GSK3β, one of the important negative regulators of insulin signal transduction in the liver. Previous studies suggested that the inhibition of GSK3 (ser9 for β subunit) in animal models of diabetes leads to the normalization of blood glucose levels and improved hepatic and peripheral insulin resistance, while high GSK3 activity has been reported in T2DM, which is also involved in diminished levels of the IPF1/PDX1 (islet transcription factor1, also known as IPF-1, IDX-1, and STF-1) protein and β cell dysfunction during the progression of diabetes[31,32]. Our findings indicate that the hypoglycemic activity of APS is mediated by insulin sensitivity improvement at least partly related to GSK3 inhibition. Further-more, it has been recently reported that GSK3 may play a central role in signaling the downstream effects of ER stress[33,34].Since ER stress-induced lipid accumulation and cell death play a role in the pathogenesis of disorders, diabetes mellitus, and hepatic steatosis[34,35], one can speculate that the protection against ER stress-induced cellular dysfunction occurs while GSK3 activity is inhibited. Thus, GSK3 inhibition undoubtedly leads to insulin sensitivity improvement which will promote a beneficial cycle coupled with the enhancement of ER function to cope with metabolic alterations.
To determine how APS performs its function on the management of metabolic abnormalities associated with obesity and diabetes, in the present study we hypothesize that the reversal of hyperglycemia, increases glucose tolerance and insulin sensitivity induced by APS is related to a decrease in ER stress so APS-treated KKAy mice should display a reduction in ER stress. Spliced XBP1 mRNA induced by activated IRE1 (Inositol-Requiring Enzyme 1) is translated to the protein, a potent transcription factor that induces BiP expression[21,25]. XBP1 is also induced by activated ATF6 (Activating Transcription Factor 6) [23]. It is thus thought to be an important marker reflecting both IRE1 and ATF6 signaling in response to ER stress[24,36]. So it is important to distinguish between the spliced and non-spliced form of XBP1 mRNA for the quantitative measurement of XBP1 gene expression[37,38]. Our data indicated that in APS-treated KKAy mice, the transcription and splicing of XBP1 in the liver was markedly reduced in comparison with the controls. Similar to these results, high glucose (30 mmol/L) was used to induce ER stress in a cultured cell model, and increased XBP1 gene expression and splicing was significantly suppressed in HepG2 cells pretreated with APS. Therefore, APS has a role in inhibiting hepatic ER stress in the state of hyperglycemia. We concluded that APS promotes insulin signal transduction, thus it enables insulin-sensitizing and hypoglycemic activity, which is related to the enhanced adaptive capacity of the ER. The alleviation of ER stress also contributes to insulin signaling. This positive interaction shows that APS has a promising application in the treatment of type 2 diabetes.
Although our results in this study show a remarkable pharmacological effect on hepatic insulin resistance, we cannot directly extrapolate our results to humans. Hence, it is necessary to reveal a more detailed mechanism of APS in the improvement of insulin resistance in humans in our future research. In conclusion, ER stress is a key link between obesity, insulin resistance, and type 2 diabetes. Our study provides new evidence that APS renders its hypoglycemic action through decreasing liver insulin resistance coupled with alleviating ER stress. In addition, the treatment of obese and diabetic mice with APS resulted in a significant alleviation of hyperglycemia, restoration of systemic insulin sensitivity, resolution of fatty liver disease, and enhancement of insulin action in liver tissue. Our research demonstrates that APS can enhance the adaptive capacity of the ER and act as potent antidiabetic modalities with promising application in the treatment of type 2 diabetes.
Acknowledgment
We appreciate the help given by the Experimental Animal Center of Wuhan University (N
References
- Kiberstis PA. A surfeit of suspects (special section––Type 2 diabetes. Science 2005;307:3692.
- Grover JK, Yadav S, Vats V. Medicinal plants of India with anti-diabetic potential. J Ethnopharmacol 2002;81:81-100.
- Mao CP, Xie ML, Gu ZL. Effects of konjac extract on insulin sensitivity in high fat diet rats. Acta Pharmacol Sin 2002;23:855-9.
- Wu F, Chen X. A review of pharmacological study on Astragalus membranaceus (Fisch) Bge. Zhong Yao Cai 2004;27:232-4.
- Wu Y, Ou-Yang JP, Wu K, Wang Y, Zhou YF, Wen CY. Hypoglycemic effect of Astragalus polysaccharide and its effect on PTP1B. Acta Pharmacol Sin 2005;26:345-52.
- Michael MD, Kulkarni RN, Postic C, Previs SF, Shulman GI, Magnuson MA, et al. Loss of insulin signaling in hepatocytes leads to severe insulin resistance and progressive hepatic dysfunction. Mol Cell 2000;6:87-97.
- Klover PJ, Mooney RA. Hepatocytes: critical for glucose homeostasis. Int J Biochem Cell Biol 2004;36:753-8.
- Ozcan U, Cao Q, Yilmaz E, Lee AH, Iwakoshi NN, Ozdelen E, et al. Endoplasmic reticulum stress links obesity, insulin action, and type 2 diabetes. Science 2004;306:457-61.
- Ji C, Kaplowitz N. ER stress: can the liver cope? J Hepatol 2006;45:321-33.
- Ni Y, Su Q, Liu X, Li XR. Experimental study of optimized techniques of water decoction extraction of Astragalus poly-saccharide. Zhongguo Zhong Yao Za Zhi 1998;23:284-6.
- Suto J, Matsuura S, Imamura K, Yamanaka H, Sekikawa K. Genetic analysis of non-insulin-dependent diabetes mellitus in KK and KK-Ay mice. Eur J Endcrinol 1998;139:654-61.
- Iwatsuka H, Shino A, Suzuoki Z. General survey of diabetic features of yellow KK mice. Endocrinol Jpn 1970;17:23-35.
- Butler L. The inheritance of glucosuria in the KK and AY mouse. Can J Genet Cytol 1972;14:265-9.
- JAX mice data sheet: strain details of C57BL/6J.Available from URL:http://jaxmice.jax.org/strain/000664.html
- Yang R, Cao L, Gasa R, Brady MJ, Sherry AD, Newgard CB. Glycogen-targeting subunits and glucokinase differentially affect pathways of glycogen metabolism and their regulation in hepatocytes. J Biol Chem 2002;277:1514-23.
- Folch J, Lees M, Sloane Stanley GH. A simple method for the isolation and purification of total lipids from animal tissues. J Biol Chem 1957;226:497-509.
- Bonora E, Targher G, Alberiche M, Bonadonna RC, Saggiani F, Zenere MB, et al. Homeostasis model assessment closely mirrors the glucose clamp technique in the assessment of insulin sensitivity studies in subjects with various degrees of glucose tolerance and insulin sensitivity. Diabetes Care 2000;23:57-63.
- Shiuchi T, Cui TX, Wu L, Nakagami H, Takeda-Matsubara Y, Iwai M, et al. ACE inhibitor improves insulin resistance in diabetic mouse via bradykinin and NO. Hypertension 2002;40:329-34.
- Gu F, Nguyen DT, Stuible M, Dube N, Tremblay ML, Chevet E. Protein-tyrosine phosphatase 1B potentiates IRE1 signaling during endoplasmic reticulum stress. J Biol Chem 2004; 279: 49 689–93.
- Berge RK, Tronstad KJ, Berge K, Rost TH, Wergedahl H, Gudbrandsen OA, et al. The metabolic syndrome and the hepatic fatty acid drainage hypothesis. Biochimie 2005;87:15-20.
- Eriksson S, Eriksson KF, Bondesson L. Nonalcoholic steatohepa-titis in obesity: a reversible condition. Acta Med Scand 1986;220:83-8.
- Roach PJ. Glycogen and its metabolism. Curr Mol Med 2002;2:101-20.
- Calfon M, Zeng H, Urano F, Till JH, Hubbard SR, Harding HP, et al. IRE1 couples endoplasmic reticulum load to secretory capacity by processing the XBP-1 mRNA. Nature 2002;415:92-6.
- Yoshida H, Matsui T, Yamamoto A, Okada T, Mori K. XBP1 mRNA is induced by ATF6 and spliced by IRE1 in response to ER stress to produce a highly active transcription factor. Cell 2001;107:881-91.
- Lee AH, Iwakoshi NN, Glimcher LH. XBP-1 regulates a subset of endoplasmic reticulum resident chaperone genes in the unfolded protein response. Mol Cell Biol 2003;23:7448-59.
- Shen X, Ellis RE, Lee K, Liu CY, Yang K, Solomon A, et al. Complementary signaling pathways regulate the unfolded protein response and are required for C elegans development. Cell 2001;107:893-903.
- Ji C, Kaplowitz N. ER stress: can the liver cope? J Hepatol 2006;45:321-33.
- Bavenholm PN, Pigon J, Ostenson CG, Efendic S. Insulin sensitivity of suppression of endogenous glucose production is the single most important determinant of glucose tolerance. Diabetes 2001;50:1449-54.
- Marchesini G, Brizi M, Bianchi G, Tomassetti S, Bugianesi E, Lenzi M, et al. Nonalcoholic fatty liver disease: a feature of the metabolic syndrome. Diabetes 2001;50:1844-50.
- DeFronzo RA. Pathogenesis of type 2 diabetes: metabolic and molecular implications for identifying diabetes genes. Diabetes Rev 1997;5:177-269.
- Jope RS, Johnson GV. The glamour and gloom of glycogen synthase kinase-3. Trends Biochem Sci 2004;29:95-102.
- Boucher MJ, Selander L, Carlsson L, Edlund H. Phosphorylation marks IPF1/PDX1 protein for degradation by glycogen synthase kinase 3-dependent mechanisms. J Biol Chem 2006;281:6395-403.
- Song L, De Sarno P, Jope RS. Central role of glycogen synthase kinase-3 beta in endoplasmic reticulum stress-induced caspase-3 activation. J Biol Chem 2002; 277: 44 701–8.
- Kim AJ, Shi Y, Austin RC, Werstuck GH. Valproate protects cells from ER stress-induced lipid accumulation and apoptosis by inhibiting glycogen synthase kinase-3. J Cell Sci 2005;118:89-99.
- Werstuck GH, Lentz SR, Dayal S, Hossain GS, Sood SK, Shi YY, et al. Homocysteine-induced endoplasmic reticulum stress causes dysregulation of the cholesterol and triglyceride biosynthetic pathways. J Clin Invest 2001;107:1263-73.
- Yoshida H, Nadanaka S, Sato R, Mori K. XBP1 is critical to protect cells from endoplasmic reticulum stress: evidence from Site-2 protease-deficient Chinese hamster ovary cells. Cell Struct Funct 2006;31:117-25.
- Hirota M, Kitagaki M, Itagaki H, Aiba S. Quantitative measurement of spliced XBP1 mRNA as an indicator of endoplasmic reticulum stress. J Toxicol Sci 2006;31:149-56.
- Iwawaki T, Akai R. Analysis of the XBP1 splicing mechanism using endoplasmic reticulum stress-indicators. Biochem Biophys Res Commun 2006;350:709-15.

