
Hypoglycemic effect of Astragalus polysaccharide and its effect on PTP1B1
Introduction
Diabetes mellitus (DM) is a chronic disease characterized by high blood glucose levels. It can be broadly categorized into type I and type II. The former develops as a result of insulin deficiency and the latter is due to defects in pancreatic secretion of insulin and insulin action[1], and insulin resistance in target tissues, mainly muscle and liver. The biological effect of insulin is initiated with insulin binding to the α-subunit of insulin receptor (IR) and activating the intrinsic tyrosine kinase activity of the β-subunit of the receptor[2]. Activated IR results in the subsequent phosphorylation of intracellular substrates including insulin receptor substrates (IRSs) such as IRS-1 and -2, phosphatidylinositol (PI) 3-kinase, and protein kinase B (PKB)[3,4]. Normal insulin action leads to increased glycogen synthesis, glucose transport, and lipogenesis, and decreased gluconeogenesis, glycogenolysis, and lipolysis[5–7]. The net effect on glucose metabolism is that hepatic glucose production is reduced, whereas use of peripheral glucose is increased[6,7].
An exquisite balance is required between kinases, which are involved in transmitting signals to the downstream targets necessary for the processes described above, and phosphatases, which are required to shut down this signaling to prevent excessive or, in some cases, insufficient activation[8]. Insulin resistance and diabetes represent states in which the regulation of the signaling pathways is altered so that the intracellular actions of insulin are absent or reduced[9]. Overactivation of phosphatases is one possible means of blocking the insulin signaling. One key phosphatase, protein tyrosine phosphatase 1B (PTP1B), which dephosphorylates the activated insulin receptor and IRS-1, has been shown to play a major role in insulin resistance and type II diabetes[10]. Recently, it was shown that PTP1B-knock-out mice become more insulin sensitive and fail to gain weight despite being fed with a fat-rich diet[11]. Moreover, the role for certain PTPs, including PTP1B, in the insulin resistance associated with diabetes and obesity, has been suggested by some clinical studies in which correlations between the levels of PTP1B expression in muscle and adipose tissue and insulin resistant states were found[12,13]. Therefore, PTP1B might be an attractive therapeutic target in the treatment of type II diabetes and obesity.
Plants have always been usable sources of drugs, and many currently available drugs are directly or indirectly derived from plants. Currently available therapies for diabetes include insulin and various oral anti-diabetic agents, such as sulfonylureas, metformin, α-glucosidase inhibitors, and rosiglitazone. These drugs are used as monotherapies or in combination to achieve better glycemic control. Each of these oral agents suffers from implication in a number of serious adverse effects[14]. Therefore, it is important to investigate the hypoglycemic actions of plants that were originally used in traditional medicine[15,16]. The biologically active components of plants with hypoglycemic actions include flavonoids, alkaloids glycosides, polysaccharides, and peptidoglycans[17,18]. Astragalus polysaccharides (APS) are one of the main efficacious principles of Radix Astragali (Astragalus membranaceus), which is reported to have anti-oxidant, anti-diabetic, anti-hypertensive, and immunomo-dulatory activities [19].
To study natural products with anti-diabetes activity, we screened our extract bank for inhibitors of PTP1B enzyme and found that a fraction from an aqueous extract of the roots of A membranaceus showed strong inhibitory bioactivity against PTP1B with IC50 equaling 7.50 µmol/L (positive control sodium orthovanadate IC50=10 µmol/L). This study was to investigate the effects of APS on the activity and expression of PTP1B in the livers and skeletal muscles of non-diabetic rats and rats with high-fat streptozotocin-induced diabetes. The effects of APS on insulin sensitivity and insulin-induced tyrosine phosphorylation of IR β-subunit and IRS-1 in non-diabetic and diabetic rats were also studied in an effort to establish the mechanisms of its hypoglycemic actions.
Materials and methods
Plant materials and preparation of APS Astragalus membranaceus (Fisch) Bunge var mongholicus (Bunge) Hsiao was purchased from Shanghai Medicinal Materials Co (Shanghai, China), and identified by the Department of Authentication of Chinese Medicine, Hubei College of Chinese Traditional Medicine (Wuhan, China). A representative specimen has been kept in our laboratory for future reference.
APS were extracted with optimized techniques using direct water decoction, as described previously[20]. The yield of APS was 2.0%, and the total polysaccharide content was 38.5%. Three subtypes of APS are defined by phytochemical screening: APSI, II, and III (1.47:1.21:1). APSI consists of D-glucose, D-galactose, and L-arabinose in molar ratios of 1.75:1.63:1 and has an average molecular weight of 36 300. Both APSII and APSIII are dextrans, the linkage mode of which is mainly α-(1→4) linkages, and in which α-(1→6) linkages are exiguous.
APS is a hazel-colored and water-soluble powder. It was diluted to 20 g/L in distilled water before use.
Materials and chemicals The reagents for sodium dodecyl sulfate–polyacrylamide gel electrophoresis (SDS–PAGE) and immunoblotting were obtained from BioVision (Palo Alto, CA, USA) and the apparatus from Bio-Rad (Richmond, CA, USA). Streptozotocin (STZ), Tris, Nonidet P-40, porcine insulin, and nitrocellulose (NC) membranes were obtained from Sigma Chemical Co (St Louis, MO, USA). Protein A–Sepharose 6 MB was from Pharmacia (Uppsala, Sweden). The monoclonal anti-phosphotyrosine antibody (αPY, PY99) was purchased from Santa Cruz Biotechnology, Inc (Santa Cruz, CA, USA). Rabbit poly-clonal anti-insulin receptor β-subunit (IRβ) antibody was purchased from Upstate Biotechnology Inc (Lake Placid, NY, USA). The anti-rat carboxy-terminal IRS-1 antibody (clone 8–63) was from NeoMarkers (Fremont, CA, USA). α-PTP1B polyclonal antibody was purchased from Upstate Biotechnology Inc. Enhanced chemiluminescence (ECL) detection reagents were from Kirkegaard & Perry Laboratories (Gaithersburg, MA, USA). All other chemicals were of the highest analytical grade.
Type II diabetic (TIIDM) rat model and treatment protocol Male Sprague-Dawley rats [from the experimental animal center of Wuhan University, certificate N
The control and diabetic groups were then further subdivided into treated and untreated groups: control (n=10); control treated with APS (Control+APS, n=10); TIIDM (n=12); and TIIDM treated with oral APS (400 mg/kg) (TIIDM +APS, n=12). Treatment was given daily for 5 weeks. The control group received an equal volume of vehicle (saline). At the end of each week, individual body weights were recorded, and glucose and insulin levels were determined under fasting and nonfasting conditions. Glycemia was assessed on blood collected from the tail vein using an OneTouch Ultra blood glucose meter (LifeScan, Milpitas, CA, USA). Insulin levels were determined by radio-immunoassay (RIA) with a kit from Beifang Biotech Research Center (Beijing, China). Before necropsy, saline- and APS-treated animals were intraperitoneally administered insulin (5 U/kg) in saline with 0.1% bovine serum albumin (BSA) or vehicle (saline with 0.1% BSA) after a 10-h fast. Tissue samples from livers and soleus muscles were taken (10 min after treatment) from both vehicle- and insulin-treated animals and snap frozen in liquid nitrogen.
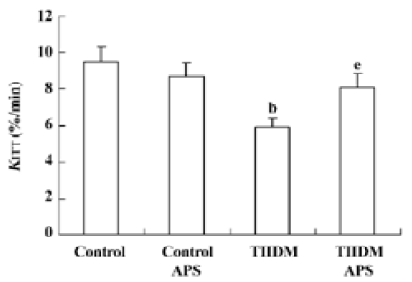
Insulin sensitivity Peripheral insulin resistance was assessed with an insulin-tolerance test (ITT) [21] that measured insulin sensitivity using KITT as an index of insulin-mediated glucose metabolism. Rats were fasted for 15 h before insulin challenge. Neutral insulin injections were diluted with 0.9% saline to a final concentration of 2 kU/L, and then administered at a dose of 2 U/kg body weight by slow intravenous injection through the tail vein. Blood samples were collected at 0, 10, 20, 30, and 60 min after the administration of insulin. Serum was separated and subjected to glucose estimation. Serum glucose concentrations were determined using a commercial assay kit (Sigma Diagnostics, St Louis, MO, USA) and 10 µL of serum was used for each assay. KITT was determined from the slope of a linear portion of the regression line of the natural logarithm of glucose versus time[21], and calculated using the formula[22]: KITT=(0.693/t1/2)×100, where t1/2 represents the half-life of plasma glucose decay, which was estimated by plotting plasma glucose concentration versus time on semilogarithmic graph paper. Lower insulin-sensitivity index (KITT) scores mean higher degrees of insulin resistance.
Lysate preparation and protein assays Frozen liver tissue (50 mg) was sonicated in 1 mL of lysis buffer (buffer A) containing Tris-HCl 20 mmol/L (pH 7.4), 1% Triton X-100, 10% glycerol, NaCl 150 mmol/L, edetic acid 2 mmol/L, β-glycerophosphate 25 mmol/L, sodium fluoride 20 mmol/L, sodium orthovanadate 1 mmol/L, sodium pyrophosphate 2 mmol/L, leupeptin 10 mg/L, benzamidine 1 mmol/L, 4-(2-aminoethyl) benzenesulfonyl fluoride hydrochloride 1 mmol/L, and microcystin 1 mmol/L, and rocked for 40 min at 4 °C. Detergent-insoluble material was sedimented by centrifugation at 12 000×g at 4 °C for 10 min. Muscle samples (50 mg) were homogenized and centrifuged at 1000 000×g for 1 h in ice-cold Hepes buffer 50 mmol/L (pH 7.4) containing NaCl 150 mmol/L, sodium pyrophosphate 10 mmol/L, Na3VO4 2 mmol/L, NaF 10 mmol/L, edetic acid 2 mmol/L, phenylmethylsulfonyl fluoride (PMSF) 2 mmol/L, leupeptin 5 mg/L, 1% Nonidet P-40, and 10% glycerol (buffer B).
Supernatants were collected, and protein concentrations were measured with Bradford protein assay reagent (Bio-Rad), using BSA as the standard.
Western blotting Aliquots (50 µg) of muscle or liver homogenates were subjected to SDS-PAGE (7.5% gel) and transferred electrophoretically onto nitrocellulose (NC) membranes for 5 h. NC membranes were then blocked for 2 h at room temperature with block solution provided in the ECL kits. This step was followed by overnight incubation at 4 °C with anti-α-PTP1B polyclonal antibody or anti-phosphotyrosine (PY99) as the primary antibodies, as described in the figure legends. The NC membranes were then washed for 30 min with wash solution (ECL kits), followed by a 1-h incubation with either anti-mouse or anti-rabbit IgG conjugated with horseradish-peroxidase in block solution. The NC membranes were washed for 30 min in wash solution, and the immunoreactive bands were detected with an enhanced chemiluminescence method.
Tyrosine phosphorylation of IR-subunit and IRS-1Muscle or liver lysates (1 mg of protein) were immunoprecipitated overnight at 4 °C with 2 µg of anti-IRβ or anti-IRS-1 coupled to protein A–Sepharose. The immune complex was washed three times in phosphate-buffered saline (PBS) (pH 7.4) containing 1% Nonidet P-40 and Na3VO4 2 mmol/L, resuspended in Laemmli buffer, and boiled for 5 min. Proteins were resolved on SDS-PAGE (7.5% gel), then electrotransferred from the gel to nitrocellulose membranes. The nitrocellulose filters were incubated at 4 ºC overnight with 1 mg/L PY99. Subsequent steps were performed as described above.
PTP1B protein levels and activity The tissue homogenate was assayed in a microtiter plate at 27 °C. The PTP1B assay kit was obtained from Upstate Biotechnology Inc. The protocol outlined by the manufacturer was followed rigidly. PTP1B protein levels were assessed by immunoblotting using polyclonal antibodies directed against PTP1B, as described above.
Statistical analysis All values are expressed as mean± SEM. Statistical significance was determined using analysis of variance (ANOVA) followed by Tukey’s test. P<0.05 was considered statistically significant.
Results
Characteristics of experimental animals The glucose levels of both fasting and fed rats were significantly higher (P<0.05) in HFD/STZ rats (TIIDM) than in normal control rats (Control) (Table 1). The levels of glucose in fasting and fed TIIDM rats were significantly reduced (P<0.05) after treatment with APS at a dose of 400 mg/kg po per day for 5 weeks (TIIDM+APS). It should be noted that insulin concentrations in type II diabetic rats were similar to values of control rats. Treatment with APS did not affect insulin levels in control or type II diabetic rats. HFD/STZ diabetic rats weighed 20 g more than the normal chow-fed controls (P<0.05). APS treatment could significantly reduce body weights in diabetic rats and had no effects on those of control rats. All data are mean±SEM calculated from 10 rats.
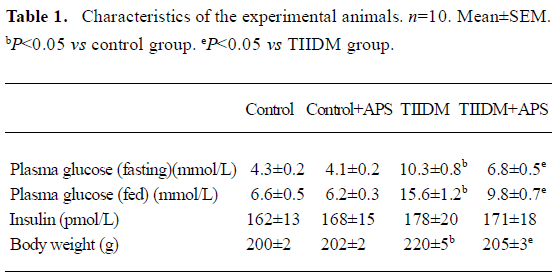
Full table
Insulin sensitivity Insulin sensitivity in the TIIDM rats was significantly lower than that in the control group. The impaired insulin sensitivity in the TIIDM rats was improved following APS treatment (Figure 1).
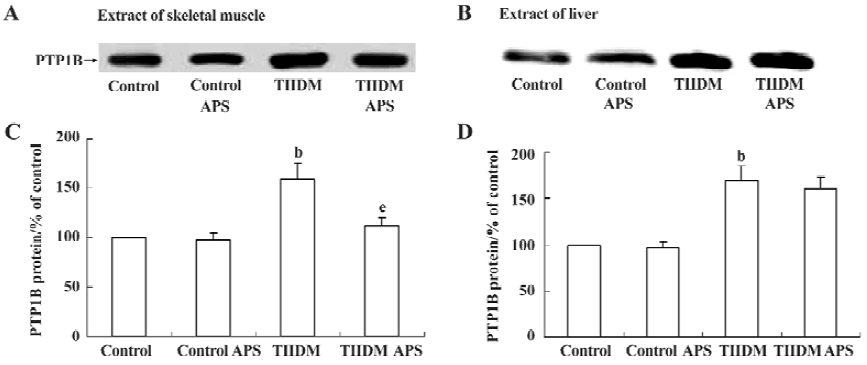
Effects of APS on PTP1B expression in muscles and livers of control and TIIDM rats PTP1B protein levels in the skeletal muscles of TIIDM rats were significantly increased (1.6-fold, P<0.05) compared with those of controls. In TIIDM rats, the level of PTP1B after treatment with APS was reduced by 30% (P<0.05), compared with that of the TIIDM rats (Figure 2A and C). PTP1B protein levels in the livers of TIIDM rats were also significantly increased (1.7-fold, P<0.05) compared with those of control rats. However, treatment with APS did not affect PTP1B protein levels in the livers of TIIDM rats (Figure 2B and D). PTP1B levels in the muscles and livers of normal control rats were not affected by APS treatment.
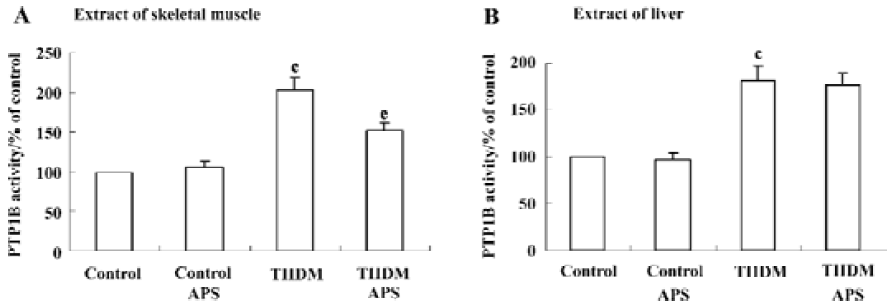
Effects of APS on PTP1B activity in muscles and livers of control and TIIDM rats There was a two-fold (P<0.01) increase in the activity of PTP1B in the skeletal muscles of TIIDM rats. APS reduced the activity of PTP1B by 25% (P<0.05) in APS-treated TIIDM rats (Figure 3A). PTP1B activity in the livers of TIIDM rats was significantly elevated (1.8-fold, P<0.01) compared with that of the controls. Treatment with APS did not change PTP1B activity in the livers of TIIDM rats (Figure 3B). Nor did APS affect the activity of PTP1B in the skeletal muscles or livers of APS-treated control rats.
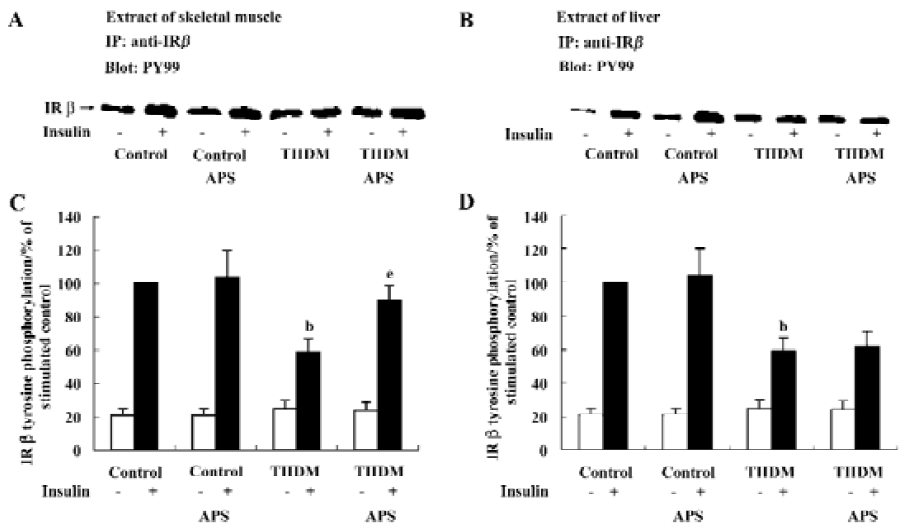
Effects of APS on insulin-induced tyrosine phosphorylation of IR β-subunit In each group of animals, the administration of insulin resulted in an increase in the tyrosine phosphorylation of the IR β-subunit (Figure 4). However, the levels of IRβ tyrosine phosphorylation in the skeletal muscles and livers of TIIDM rats after stimulation with insulin were reduced by 47% (P<0.05) and 41% (P<0.05), respectively, compared with those of the control rats (Figure 4). Treatment with APS significantly increased the level of IRβ tyrosine phosphorylation stimulated by insulin in the skeletal muscles of TIIDM rats, but did not affect that in the livers of TIIDM rats. APS also did not affect the IRβ tyrosine phosphorylation stimulated by insulin in the skeletal muscles or livers of APS-treated control rats, as evaluated by scanning densitometry.
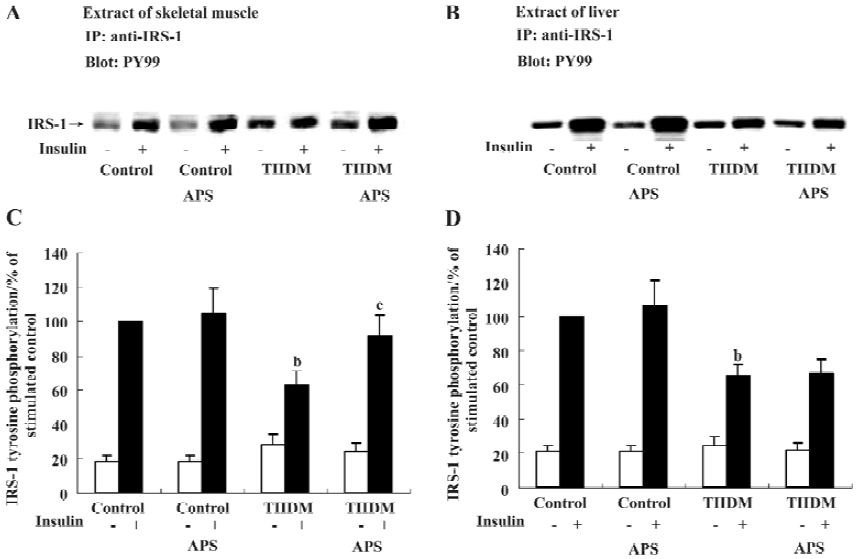
Effects of APS on insulin-induced tyrosine phosphorylation of IRS-1 Insulin administration resulted in an increase in IRS-1 tyrosine phosphorylation in each group of animals (Figure 5). TIIDM rats exhibited a reduced response to insulin, and the levels of tyrosine phosphorylation of IRS-1 after insulin stimulation in skeletal muscles and livers were reduced by 37% and 35% (P<0.05), respectively, compared with the values measured in control rats (Figure 5). APS treatment did not increase the level of tyrosine phosphorylation of IRS-1 induced by insulin in the liver tissues of TIIDM rats, but significantly improved that in skeletal muscles (P<0.05) in TIIDM rats. APS had no effect on the tyrosine phosphorylation of IRS-1 stimulated by insulin in the skeletal muscles or livers of APS-treated control rats.
Discussion
In the present study, we developed an animal model for type II diabetes, the HFD/STZ rat. These rats constitute a relatively inexpensive and easily accessible rodent model that is not extremely obese and simulates the natural history and metabolic characteristics of patients with type II diabetes[23]. Recent reports[24] have indicated that insulin resistance may be caused by an excess nutrient supply. Both excess glucose and excess fat can cause insulin resistance in muscle and fat tissues, whereas excess fat can cause impaired suppression of endogenous glucose production. The present animal model was based on the rationale described above. At first, we used high-fat diets to induce insulin resistance in Sprague-Dawley rats. Plasma glucose concentrations were similar in chow-fed and HFD rats after two weeks of the high-fat diet, whereas insulin concentrations in the HFD rats were significantly higher than those in the chow-fed controls (HFD: 338±25 vs Control: 162±13 pmol/L, P<0.05). The association of normoglycemia and hyperinsulinemia suggested that the HFD rats were insulin-resistant. Conversion of pre-diabetes to frank hyperglycemia in patients with type II diabetes is associated with a decline in the secretory capacity of the pancreatic β-cells[25,26]. However, this fai-lure in β-cell compensation is relative, not absolute[23]. We attempted to simulate this evolution from a state of insulin resistance and absolute hyperinsulinemia to a state of “relative” hypoinsulinemia by injecting insulin-resistant HFD rats with a moderate amount of STZ, which partly damaged β-cell and reduced the serum insulin concentration to a relatively lower level (178±20 pmol/L), which is approximately that of normal chow-fed rats. Comparison of the data in Table 1 indicates that we were successful in this attempt.
The signaling pathways affected by the inhibition of PTP1B, particularly in a diabetic model, have been characterized. In this study, we observed increased PTP1B activity in skeletal muscle and liver tissues of HFD/STZ rats when para-nitrophenyl phosphate (pNPP) was used as substrate. These changes were similar to those in PTP1B protein levels in the tissues. Corresponding to these results, insulin-induced tyrosine phosphorylation of the IR β-subunit and IRS-1 were significantly decreased in muscle and liver tissues. This is the first study to demonstrate the in vivo effects of changes in PTP1B activity and expression on insulin signaling molecules in the skeletal muscles and livers of HFD/STZ rats.
Using reduced carboxymethylated-maleylated (RCM)-lysozyme as a substrate, Seiichi Tagami[27] and McGuire et al[28] found increases in PTP1B activity in the skeletal muscles of insulin-resistant Otsuka Long-Evans Tokushima fatty (OLETF) rats and insulin-resistant human subjects, relative to the activity in the corresponding control groups. Muscle PTP1B activity, measured with myelin basic protein and the insulin-receptor cytoplasmic domain as substrates, was also increased in an animal model of insulin-resistant obesity and DM[10]. Those findings accord with our results. It is reasonable to postulate that increased PTP1B activity in the muscle and liver contributes to insulin resistance and type II diabetes in HFD/STZ rats because PTP1B inhibits tyrosine phosphorylation of the insulin receptor and its substrates, including IRS-1.
Our own earlier ethnopharmacological studies of an aqueous extract of Astragalus confirm the data reported for the plant A membranaceus, which is traditionally used as an infusion of (mainly) roots by the Chinese population to treat type II diabetes. Most important of all, A membranaeus is an important component of the majority of traditional herbal blend prescriptions used to cure type II diabetes in traditional Chinese medicine. The unique nature of the A membranaceus extract inspired us to work towards the isolation of the active ingredient from the crude extract. When subjected to sequential extraction, maximum activity was found in APS. In the present study, we found that APS significantly reduced both PTP1B protein levels and activity in the skeletal muscles, but not in the livers of HFD/STZ rats. Consistent with this change, the insulin-induced tyrosine phosphorylation of the IR β-subunit and IRS-1 increased in the skeletal muscles, but not in the livers of APS-treated TIIDM rats. Furthermore, blood glucose levels were controlled and insulin sensitivity was apparently improved in APS-treated TIIDM rats when KITT was used as an index of glucose metabolism. This is a simple, reasonably accurate, and rapid method for screening insulin resistance[29], and indicates the net resistance to insulin at the target level, including receptor and post-receptor defects. The data collected in this study indicate that blood insulin levels are not altered by treatment with APS in TIIDM rats, suggesting that the hypoglycemic effects of APS are not mediated through insulin secretion. In addition, HFD/STZ rats had a higher body weight than that of normal rats. The effect of STZ injection plus high fat diet on body weight gain is in accordance with the earlier findings[23,30]. APS could decrease body weight in diabetic rats. It has been suggested that PTP1B can act as a negative regulator of leptin signaling by dephosphorylating the leptin receptor associated kinase Jak2[31,32]. So one can postulate that the obesity resistance effect of APS be associated with enhanced leptin sensitivity induced by its inhibitory action on PTP1B.
PTP1B is a well-established drug target in the treatment of TIIDM and obesity[33]. However, the PTP family of enzymes is large, and all are highly specific for charged phosphotyrosine residues. Finding a selective small-molecule inhibitor of PTP1B is therefore proving difficult. Numerous PTP1B-inhibiting candidates are undergoing trials, but significant success has yet to be achieved[34]. Our study showed that protein levels of PTP1B changed in parallel with changes in its activities in skeletal muscle and liver. The alterations in PTP1B activities may be partly due to changes in its protein levels. Therefore, we postulate that the inhibitory effect of APS on PTP1B activity is most likely mediated by the inhibition of PTP1B protein expression. Detailed studies are in progress in our laboratory to clarify the mechanism underlying the inhibitory action of APS on PTP1B. In the present study, our data suggest that APS induces normalization of PTP1B activity in the muscles, leading to an improvement in insulin sensitivity. However, changes in PTP1B activity alone may not account for the complete insulin-sensitizing effect of APS. Other possible mechanisms cannot be excluded.
In conclusion, we have presented evidence to substantiate the anti-diabetic and insulin-sensitizing effects of the A membranaceus extract, APS. The insulin-enhancing effects of APS are at least partially exerted through its effects on PTP1B in skeletal muscle. The results of this study support this hypothesis, at least in this animal model.
Acknowledgments
We thank R William CALDWELL, PhD, Ron DUNDORE, PhD, and Herman RHEE, PhD for valuable discussion and critical review of the manuscript. We also acknowledge the Young Investigator Award received by Yong WU presented by the Division for Drug Discovery, Drug Development and Regulatory Affairs of the American Society for Pharmacology and Experimental Therapeutics.
References
- Kahn BB. Type 2 diabetes: when insulin secretion fails to compensate for insulin resistance. Cell 1998;92:593-6.
- Leng Y, Karlsson HK, Zierath JR. Insulin signaling defects in type 2 diabetes. Rev Endocr Metab Disord 2004;5:111-7.
- White MF, Kahn CR. The insulin signaling system. J Biol Chem 1994;269:1-4.
- Saltiel AR. Diverse signaling pathways in the cellular actions of insulin. Am J Physiol Endocrinol Metab 1996;270:E375-85.
- Kahn BB, Flier JS. Obesity and insulin resistance. J Clin Invest 2000;106:473-81.
- Newsholme EA, Dimitriadis G. Integration of biochemical and physiologic effects of insulin on glucose metabolism. Exp Clin Endocrinol Diabetes 2001;109 Suppl 2:S122-34.
- Saltiel AR. New perspectives into the molecular pathogenesis and treatment of type 2 diabetes. Cell 2001;104:517-29.
- Rebecca JG, Lori LG, Sandra LK, Matthew H, Jill EC, Bradley AZ, et al. Reduction of protein tyrosine phosphatase 1B increases insulin-dependent signaling in ob/ob mice. Diabetes 2003;52:21-8.
- Steppan CM, Lazar MA. Resistin and obesity-associated insulin resistance. Trends Endocrinol Metab 2002;13:18-23.
- Ahmad F, Goldstein BJ. Increased abundance of specific skeletal muscle protein-tyrosine phosphatases in a genetic model of insulin-resistant obesity and diabetes mellitus. Metabolism 1995;44:1175-84.
- Elchebly M, Payette P, Michaliszyn E, Cromlish W, Collins S, Loy AL, et al. Increased insulin sensitivity and obesity resistance in mice lacking the protein tyrosine phosphatase-1B gene. Science 1999;283:1544-8.
- Ahmad F, Azevedo JL, Cortright R, Dohm GL, Goldstein BJ. Alterations in skeletal muscle protein-tyrosine phosphatase activity and expression in insulin-resistant human obesity and diabetes. J Clin Invest 1997;100:449-58.
- Kusari J, Kenner KA, Sub KI, Hill DE, Henry RR. Skeletal muscle protein-tyrosine phosphatase activity and tyrosine phosphatase 1B protein content are associated with insulin action and resistance. J Clin Invest 1994;93:1156-62.
- Zhang BB, Moller DE. New approaches in the treatment of type 2 diabetes. Curr Opin Chem Biol 2000;4:461-7.
- Alarcon-Aguilara FJ, Rornan-Ramos R, Perez-Gutierrez S. Study of the anti-hyperglycemic effect of plants used as antidiabetics. J Ethnopharmacol 1998;61:101-10.
- Wu YC, Hsu JH, Liu IM, Liou SS, Su HC, Cheng JT. Increase of insulin sensitivity in diabetic rats received die-huang-wan, a herbal mixture used in Chinese traditional medicine. Acta Pharmacol Sin 2002;23:1181-7.
- Grover JK, Yadav S, Vats V. Medicinal plants of India with anti-diabetic potential. J Ethnopharmacol 2002;81:81-100.
- Mao CP, Xie ML, Gu ZL. Effects of konjac extract on insulin sensitivity in high fat diet rats. Acta Pharmacol Sin 2002;23:855-9.
- Wu F, Chen X. A review of pharmacological study on Astragalus membranaceus (Fisch) Bge. Zhong Yao Cai 2004;27:232-4.
- Ni Y, Su Q, Liu X, Li XR. Experimental study of optimized techniques of water decoction extraction of Astragalus polysaccharide. Zhongguo Zhong Yao Za Zhi 1998;23:284-6.
- Alford FP, Martin FIR, Pearson MJ. Significance and interpretation of mildly abnormal oral glucose tolerance test. Diabetalogia 1971;7:173-80.
- Lundbaek K. Intravenous glucose tolerance as a tool in definition and diagnoses of diabetes mellitus. Br Med J 1962;5291:1507-13.
- Reed MJ, Meszaros K, Entes LJ, Claypool MD, Pinkett JG, Gadbois TM, et al. A new rat model of type 2 diabetes: the fat-fed, streptozotocin-treated rat. Metabolism 2000;49:1390-6.
- Proietto J, Filippis A, Nakhla C, Clark S. Nutrient-induced insulin resistance. Mol Cell Endocrinol 1999;151:143-9.
- Lillioja S, Mott DM, Spraul M, Ferraro R, Foley JE, Ravussin E, et al. Insulin resistance and insulin secretory dysfunction as precursors of non-insulin-dependent diabetes mellitus. N Engl J Med 1993;329:1988-92.
- Warram JH, Martin BC, Krowleski AS, Soelener JS, Kahn CR. Slow glucose removal rate and hyperinsulinemia precede the development of type II diabetes in the offspring of diabetic patients. Ann Intern Med 1990;113:909-15.
- Tagami S, Sakaue S, Honda T, Yoshimura H, Homma H, Ohno K, et al. Effects of troglitazone on skeletal muscle and liver protein tyrosine phosphatase activity in insulin-resistant Otsuka Long-Evans Tokushima fatty rats. Curr Ther Res Clin 2002;63:572-86.
- McGuire MC, Fields RM, Nyomba BL, Raz I, Bogardus C, Tonks NK, et al. Abnormal regulation of protein tyrosine phosphatase activities in skeletal muscle of insulin-resistant humans. Diabetes 1991;40:939-42.
- Grulet H, Duriach V, Hecart AC, Gross A, Leutenegger M. Study of the rate of early glucose disappearance following insulin injection, insulin sensitivity index. Diabetes Res Clin Pract 1993;20:201-7.
- Leng SH, Lu FE, Xu LJ. Therapeutic effects of berberine in impaired glucose tolerance rats and its influence on insulin secretion. Acta Pharmacol Sin 2004;25:496-502.
- Myers MP, Andersen JN, Cheng A, Tremblay ML, Horvath CM, Parisien JP, et al. TYK2 and JAK2 are substrates of protein-tyrosine phosphatase 1B. J Biol Chem 2001;276:47771-4.
- Zabolotny JM, Bence-Hanulec KK, Stricker-Krongrad A, Haj F, Wang Y, Minokoshi Y, et al. PTP1B regulates leptin signal transduction in vivo. Dev Cell 2002;2:489-95.
- van Huijsduijnen RH, Bombrun A, Swinnen D. Selecting protein tyrosine phosphatases as drug targets. Drug Discov Today 2002;7:1013-9.
- Brown M. A tale of two necessities: breakaway technology versus diabetes. Drug Discov Today 2003;8:561-2.